Collective efficacy can be defined as “a group’s shared beliefs in its conjoint capability to organize and execute the courses of action required to produce given levels of attainment” (Bandura, 1997, p. 477). The construct originates from social cognitive theory and Bandura’s hypothesis that a person’s beliefs about his or her team influence the group’s overall performance (Bandura, 1997). In the school context, the notion of collective teacher efficacy (CTE) refers to teachers’ shared beliefs about their joint efforts in terms of motivation, actions, and behaviors to organize and execute courses of actions required to produce student success (Goddard, 2002; Goddard; 2004). Hence, teachers’ perceptions of collective efficacy represent a unique property related to each school context. The present study aimed to contribute to the field by investigating the psychometric properties of CTE in a Scandinavian context, as represented by Norway.
A substantial amount of research has documented the impact of CTE in the school setting. At the school level, findings show that high levels of perceived CTE are beneficial for teachers’ practices and classroom management (Allinder, 1994; Friedman & Farber, 1992; Muijs & Reynolds, 2002). At the student level, CTE predicts student attitudes, motivation, and academic achievement (Midgley, Feldlaufer, & Eccles, 1989; Eells, 2011; Goddard, 2001; Goddard, Hoy, & Hoy, 2000; Moolenaar, Sleegers, & Daly, 2012) and inversely relates to misconduct, both concurrently and over time (Sørlie & Torsheim, 2011). A meta-analysis (Eells, 2011) demonstrated that CTE shows overall strong and positive relations to student achievement across multiple samples and settings. A synthesis of several hundred meta-analyses by Donohoo, Hattie, and Eells (2018) concluded that CTE is up to three times more predictive for students’ academic achievement (d = 1.57), compared to, for instance, prior achievements (d = 0.65), socioeconomic status (d = 0.52), home environment (d = 0.52), parental involvement (d = 0.49), student motivation (d = 0.48), and homework (d = 0.29). The broad and significant impact of CTE has situated the concept at the top of the list of factors influencing student achievement (Hattie, 2012).
Predictors of Perceived Collective Teacher Efficacy
Even though research has demonstrated a connection between CTE and different student and teacher outcomes, less is known about how teacher and school characteristics influence perceptions of CTE (Adams & Forsyth, 2006; Goddard & Skrla, 2006; Ninković & Knežević Florić, 2018). Social cognitive theory suggests that perceptions of a group’s capabilities originate from four main sources of information: mastery experience, vicarious experience, social persuasion, and affective states (Bandura, 1986). Research has provided support for these four as remote sources of efficacy (Goddard et al., 2003; Hoy et al., 2003; Ross et al., 2003). Still, it has been argued that other teacher (e.g., gender and class level taught) and contextual characteristics (e.g., school size and structure) may influence teachers’ assessments of CTE (Adam & Forsythe, 2006; Goddard & Skrla, 2006; Ninković & Knežević Florić., 2018). At present, the socioeconomic status of the student group (Bandura, 1993; Goddard et al., 2003; Hoy et al., 2003) and transformational school leadership (Ross et al., 2006; Ninković & Knežević Florić, 2018) are among the contextual variables that have been empirically tested and shown to influence CTE. Additionally, Goddard and Skrla (2006) found that a school’s past academic achievement level, rate of special program placement for gifted children, and ethnic composition of the faculty explained 46% of the variation in teachers’ perceived collective efficacy. They also found a small but significant relationship between CTE and teachers’ race and work experience. Specifically, Hispanic and Afro-American teachers and those with more than 10 years of experience reported slightly higher levels of CTE. Obviously, more research exploring how demographic factors influence teachers’ perceptions of CTE is necessary. Further, given that the majority of research on CTE derives from a US context, research from other cultural settings is warranted.
Measurement of Teachers’ Sense of Collective Efficacy
The Collective Teacher Efficacy Instrument—Short Form (CTE-12; Goddard, 2002) is an often-used rating scale that measures teachers’ perceived collective efficacy at school. The scale consists of 12 items chosen from the original Collective Efficacy Scale (Goddard, Hoy, & Hoy, 2000; Tschannen-Moran, Woolfolk Hoy, & Hoy, 1998). Findings indicate that the original instrument and the CTE-12 are strongly correlated (r = .98) (Goddard, 2002). CTE-12 covers the two factors of group teaching competence and task analysis (hereafter referred to as competence and task). Competence refers to judgments about teachers’ joint capability to motivate and support student learning, including skills and expertise. The task factor reflects teachers’ perceptions of the external opportunities and limitations related to the teaching task at their school, that is, students’ motivations and support from parents and the community (Goddard et al., 2000). Although this bipartite structure has been theoretically recognized and empirically supported (Fives & Looney, 2009; Goddard et al., 2004; Ross & Gray, 2006; McCoach & Colbert, 2010), Goddard and colleagues (2000) have advocated for a one-dimensional construct, referring to the importance of the whole rather than the sum of their parts. In practice, CTE-12 is often used as an additive index.
The rationale behind the selection of the items was based on multiple criteria, including the size of the factor coefficients, substantive concerns, and historical reasons (Goddard, 2002). The overall aim was to create a more balanced and parsimonious version of the original instrument (Goddard, Hoy, & Woolfolk Hoy, 2000) in terms of content (an equal number of items representing group competence and task analysis) and wording (an equal number of positively and negatively worded items). Thus, CTE-12 encompasses six positively and six negatively worded items evenly distributed across the two factors of task and competence.
The Present Study
The purpose of the present study was to investigate the psychometric properties of the CTE-12 in a Norwegian context. We extend previous research on the CTE-12 in several ways. First, we estimated the item network to gain insight into how the different indicators were connected. Second, we investigated construct validity, considering the two-level structure of the data (i.e., teachers are nested within schools). Third, we explored how teacher and school characteristics are related to teachers’ perception of CTE. More research on factors that can serve to increase CTE is warranted (e.g., Danohoo, O’Leary, & Hattie, 2020). Fourth, we investigated the associations between CTE-12 and students’ academic achievements (academic level in class and academic differences in class) and problem behaviors in school (serious and less serious) to enhance knowledge about the instrument’s criterion validity.
To our knowledge, this is the first paper to examine the network structure of CTE-12, which provides valuable knowledge about how the items that make up the concept are connected with each other. We adopted a confirmatory approach to investigate whether the items best fitted a general one-factor solution or a two-factor structure reflecting task and competence. Considering criterion validity, we expected that CTE would relate positively to student academic achievements and negatively to academic differences and problem behaviors. Thus, if CTE-12 shows significant correlations in the expected directions with students’ social functioning and academic competence concurrently and over time, this would provide evidence of criterion validity.
Methods
Participants and Procedures
Data stem from 1,528 teachers from 65 Norwegian primary schools (Grades 1 to 7) participating in a large longitudinal effectiveness study. The study was based on a strengthened nonrandomized experimental design where several elements were added to the design in order to minimize potential threats to the internal and external validity (e.g., stratification, matching and randomized invitation of schools, multiple assessment points, for more details, see Sørlie & Ogden, 2014). The present data derive from the two first waves of data collection, prior to the initiation of the interventions, at the beginning and end of a school year. Four teachers did not respond to any CTE items, resulting in data from 1,524 teachers from all participating schools. Questionnaires were available both on the internet and on paper, and teachers were free to choose either of the formats. Written instructions were given to standardize the assessment procedures. Assent was obtained when filling in the questionnaire. To secure privacy, a randomly derived ID code was used as an anonymous substitute for name or e-mail address. To facilitate the data collection, a research contact was elected in each school and trained by a research assistant.
Measurements
Collective teacher efficacy
Collective teacher efficacy in schools was measured at T1 using the short 12-item version of the Collective Teacher Efficacy Scale (CTE-12; Goddard, 2002; Goddard, Hoy, & Woolfolk Hoy, 2000). CTE-12 covers two sub-dimensions of collective efficacy: group competence and task analysis. Item examples are: “Teachers in this school are able to get through to the most difficult students”; “Teachers in this school believe that every child can learn”; and “Students here are just not motivated to learn.” Teachers describe their extent of agreement with the statements on a 6-point scale (from strongly disagree to strongly agree). Cronbach’s alpha for the total scale was .82 and .79 for group competence and .73 for task analysis.
Social functioning and academic achievement
Academic achievement was measured at the class level at T1 and T2 (five months after T1). The teachers assessed the mean academic level and differences (dispersion) in their classes (i.e., the class in which they had most lessons) on a 13-item scale (Ogden, 1998). Item examples are: “The mean ability level in class is…”; “The mean academic level of achievement in class is…”; and “The academic efforts in class are….” Items were evaluated on a 4-point Likert scale (1 = below mean/small differences, 4 = very good/very large differences). Cronbach’s alphas for “Academic level in class” were .88 (T1) and .87 (T2) and for “Academic differences in class” .89 (at T1 and T2).
Problem behaviors in school were measured using a 15-item scale developed by Grey and Sime (1989) at T1 and T2. The teachers reported how many times they had observed more and less severe behavior incidences outside the classroom context during a random week (i.e., the week before assessment). A 5-point Likert scale was applied, with scoring alternatives ranging from 1 (not observed) to 5 (observed several times per day). The Cronbach’s alphas for “Serious problem behaviors in the school environment” were .53 (T1) and .80 (T2), and for “Less serious problem behaviors in the school environment” .52 (T1) and .80 (T2). Item examples are “Running in corridors” (less serious incident) and “Physical attacks on students” (severe incident).
Demographics
The following teacher and school characteristics were included in the analyses: teacher gender (1 = male, 0 = female), teacher age (1 = below 25 years, 6 = above 67 years), teacher work experience (1 = 1 year, 6 = more than 20 years), teacher work load (less than 50% = 1, more than 100% = 4), teaching level (1–4 grade = 1, 5–7 grade = 2, mixed = 3), and school size (small = n < 200 students, medium = 201–350 students, large = 351–780 students).
Statistical Analyses
An important first step in the validation of CTE in the Norwegian context was to examine how the scale items were connected and second, whether they, as in the US-context, clustered together in the two expected sub-dimensions. A combination of Network Analysis (NA) and multilevel Confirmatory Factor Analysis (CFA) was used. Most often, tests or scales are used to measure psychological attributes of individuals or groups, where scores on observed variables (indicators, items) are seen as estimates of an underlying latent variable (e.g., in Exploratory Factor Analysis, EFA). In other words, within this traditional latent framework, the items are seen as manifestations of a particular underlying attribute (e.g., Kline, 2011). However, the validity of the latent model framework has been challenged. Recently, NA has been proposed as a more appropriate approach because it is closer to reality than conventional approaches entailing latent variables (Borsboom & Cramer, 2013; Costantini et al., 2015; De Schryver et al., 2015). In NA observed variables (nodes) are treated as interacting and reinforcing elements of the overarching concept examined (e.g., CTE). The network of relationships between the items is considered to constitute the psychological attribute (De Schryver et al., 2015). According to Gyon et al. (2017), psychological attributes thus exist as systems where components mutually influence each other without the need to call on latent variables. NA can reveal the connections between the different entities (e.g., CTE items).
Figuratively depicted, a network consists of nodes (perceptions) connected by edges (positive in green and negative in red), where more strongly connected nodes are indicated by thicker and more saturated edges (Epskamp et al., 2012). Given that a network often contains many arbitrary small weights between nodes, representing false positive or negative relations due to spurious connections (i.e., “type 1 error”), the adaptive LASSO penalty (Friedman, Hastie, & Tibshirani, 2008) was applied, which sets small connections to zero. The network presents partial correlations; thus, connections between any of the nodes are the association left after controlling for all other connections in the network. Relying on partial correlations avoids a situation in which a correlation represented in a network is spurious, for example, because of shared variance with a third variable. More details about the estimation of networks are available elsewhere (Costantini et al., 2015; Epskamp & Fried, 2016). Analyses were conducted in JASP version 0.11.1 (JASP Team, 2019).
To investigate rigorously the factor structure of CTE, we followed Muthén’s (1994) five-step procedure: (1) conventional confirmatory factor analysis (CFA), (2) inspection of intraclass correlations, (3) estimate within-level factor structure, (4) estimate between-level factor structure, and (5) multilevel CFA (Muthén, 1994). The first four steps provide initial information about the factor structure of CTE at different levels and provide justification for applying multilevel analyses. The last step provides a method for analyzing CTE at multiple levels simultaneously, given the nested data structure (i.e., teachers are nested within schools). In multilevel CFA, the within- and between-level models are analyzed at the same time using a pooled within-sample covariance matrix and a between-sample covariance matrix (Muthén, 1994). The size of the intraclass correlations (ICC), which is the proportion of between-school variance to the total variance, ranges from 0 to 1, where values of .05 or greater support the application of multilevel analysis (Musca et al., 2011). All analyses were conducted in Mplus 7.3 (Muthén & Muthén, 1998–2014) using maximum likelihood estimation with robust standard errors (MLR; Asparouhov & Muthén, 2007; Muthén, 1984). In addition, analyses included school ID as a cluster subcommand. Since the chi-square is sensitive to sample size, we consulted three additional fit indexes when evaluating model fit: the comparative fit index (CFI), the root mean square error of approximation (RMSEA), and the standardized root mean square residual (SRMR). A CFI equal to or higher than .90/.95 indicates an acceptable/excellent fit, whereas a RMSEA/SRMR of .05/.08 or smaller indicates an acceptable/close model fit (Hu & Bentler, 1999).
Relationships between demographics and CTE were examined by regressing teacher gender (female = 0, male = 1), teacher age, work experience (years), workload, teaching level (most of the time), and school size on CTE. Concurrent and predictive validity were examined by inspecting correlations between CTE and social functioning and academic achievement within and over time.
Results
Descriptives
Data were derived from 1,528 teachers from 65 schools, with an average number of 23 teachers from each school. Baseline comparisons indicated that the sample was representative of Norwegian primary schools in that the 65 participating schools and the 21 municipalities in which they were located only differed significantly from the Norwegian average on one of 20 variables tested (see Sørlie & Ogden, 2014). In addition, the number of small, medium, and large schools in this sample was in line with national statistics (Statistics Norway, 2009a). Table 1 presents teacher sample characteristics and shows that about 81% (N = 1,244) of the teachers were female, which is somewhat higher than the national 30:70 male–female ratio (Statistics Norway, 2009b). The majority of the teachers were aged ≥ 36, and only 15.8% had less than five years of experience in school.
| CHARACTERISTICS | FREQUENCY | % |
|---|---|---|
| Gender (female): n (%) | 1,244 | 81.4 |
| Age (years) | ||
| Under 25 | 29 | 1.9 |
| 25-35 | 347 | 22.7 |
| 36-45 | 446 | 29.2 |
| 46-55 | 413 | 27.0 |
| 56-67 | 288 | 18.8 |
| > 67 | 5 | .3 |
| Work experience (years) | ||
| 1 | 66 | 4.3 |
| 2-4 | 175 | 11.5 |
| 5-10 | 412 | 27.0 |
| 11-15 | 317 | 20.7 |
| 16-20 | 154 | 10.1 |
| >20 | 404 | 26.4 |
| Work load | ||
| >100% | 39 | 2.6 |
| 100% | 920 | 60.2 |
| 50-99% | 524 | 34.3 |
| <50% | 45 | 2.9 |
| School size | ||
| small (50-150) | 53 | 3.5 |
| medium (151-250) | 281 | 18.4 |
| large (>251) | 1,172 | 76.7 |
| Teaching level (grade) | ||
| 1-4 | 835 | 54.6 |
| 5-7 | 668 | 43.7 |
| mixed | 25 | 1.6 |
N = 1,528
All CTE items showed mean scores above the mid-point. Skewness and kurtosis were within the normal range for all variables (±2; Field, 2000), except for item 10 (“Learning is more difficult at this school because students are worried about their safety,” kurtosis = 4.19; skewness = –1.81) and item 11 (“Drug and alcohol abuse in the community make learning difficult for students here,” kurtosis = 2.85; skewness = –1.75), which both showed a leptokurtic and negatively skewed distribution (Table 2).
| # ITEM | FACTOR | M | SD | SKEW | KUR | ICC |
|---|---|---|---|---|---|---|
| CE01. Teachers in this school are able to get through to difficult students | GC | 4.41 | .93 | –.72 | .76 | .12 |
| CE02. Teachers here are confident they will be able to motivate their students | GC | 4.37 | .88 | –.66 | .69 | .06 |
| CE03. Teachers in this school really believe every child can learn | GC | 4.81 | 1.00 | –.98 | 1.21 | .06 |
| CE04. If a child doesn’t want to learn teachers here give up* | GC | 5.00 | 1.01 | –1.08 | .96 | .04 |
| CE05. Teachers here don’t have the skills needed to produce meaningful student learning* | GC | 4.85 | 1.11 | –.97 | .50 | .04 |
| CE06. These students come to school ready to learn | TA | 4.16 | 1.03 | –.54 | .15 | .05 |
| CE07. Home life provides so many advantages the student here are bound to learn | TA | 4.05 | .98 | –.50 | .13 | .17 |
| CE08. Students here just aren’t motivated to learn* | TA | 4.70 | .95 | –.64 | .05 | .06 |
| CE09. The opportunities in this community help ensure that these students will learn | TA | 4.26 | 1.04 | –.70 | .16 | .14 |
| CE10. Learning is more difficult at this school because students are worried about their safety* | TA | 5.34 | .89 | –1.81 | 4.19 | .15 |
| CE11. Drug and alcohol abuse in the community make learning difficult for students here* | TA | 5.37 | .95 | –1.75 | 2.85 | .18 |
| CE12. Teachers in this school do not have the skills to deal with student disciplinary problems* | GC | 4.56 | 1.28 | -.61 | .36 | .12 |
Note. *Items are reversed; a high value reflects more positive collective efficacy. GC = group competence. TA = task analysis. M = mean. SD = Standard Deviation. Skew = skewness. Kur = kurtosis. ICC = Intraclass correlation
Interclass correlations (ICCs) ranged from .04 to .18, indicating that 4–18% of the variance in CTE items was derived from between-school variations. Notably, ICCs for half of the items were low (ICC ≤ .06; see Table 2). A mean ICC of .10 does, however, indicate a sizable between-school heterogeneity and that the multilevel structure of the data should be taken into account (Musca et al., 2011).
CTE Network
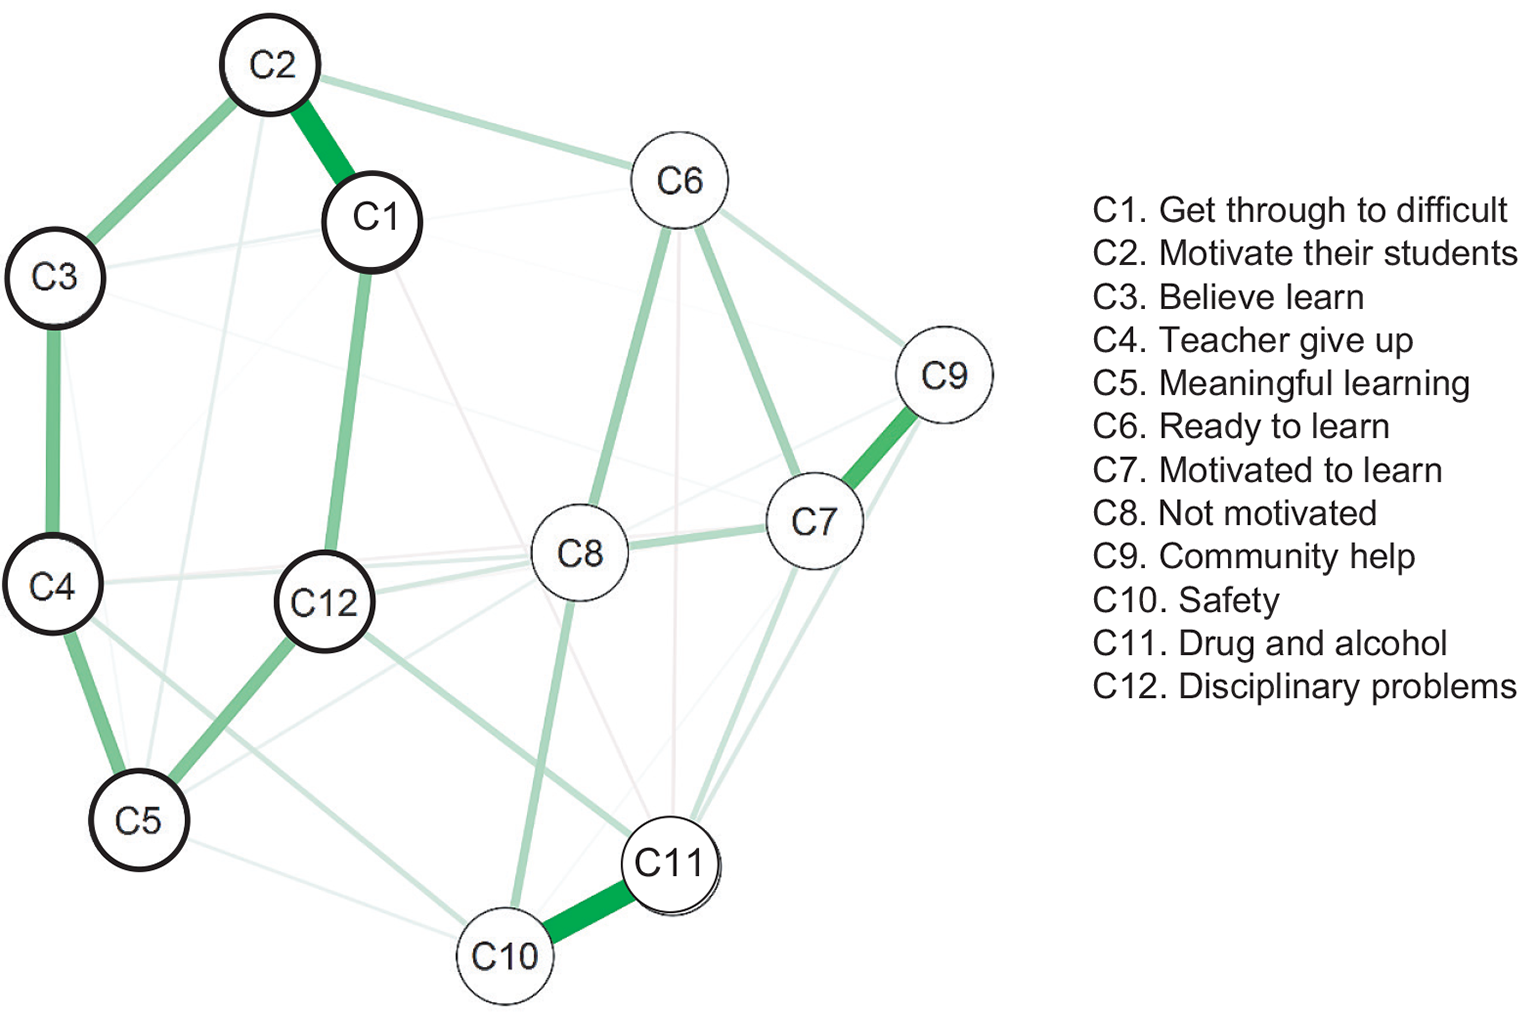
First, network analysis was applied to gain insight into how the twelve items connect and interact. Figure 1 shows the partial correlation network, i.e., the associations between items left after controlling for all other associations. Among the 66 edges, 46 were non-zero, and overall the nodes were positively connected (i.e., green edges). Particularly strong associations emerged between three item pairs: “Teachers in this school are able to get through to difficult students” and “Teachers here are confident they will be able to motivate their students” (item 1 and 2, partial r = .49); “Learning is more difficult at this school because students are worried about their safety” and “Drug and alcohol abuse in the community make learning difficult for students here” (item 10 and 11, partial r = .52); and “Home life provides so many advantages the students here are bound to learn” and “The opportunities in this community help ensure that these students will learn” (item 7 and 9, partial r = .37). The results show that these item pairs tend to co-occur. Further, the network reveals that the competence items cluster together, supporting the position that they make up a separate factor.
Multilevel CFA
In the total sample (ignoring the level structure), the two-factor structure reflecting task and competence provided the best model fit in terms of a lower chi-square, RMSEA, and CFI when compared with the one-factor model (Table 3). None of these models, however, obtained RMSEA or CFI values within the range for acceptable fit. Similar results were obtained for the models analyzed at the between-level (N = 65). At the within-level (N = 1,528), however, the two-factor solution outperformed the one-factor model and obtained values within acceptable ranges (RMSEA = .069, CFI = .92, SRMR = .05).
| χ² (DF) | RMSEA | CFI | SRMR | |
|---|---|---|---|---|
| Total sample | ||||
| One factor | 690.69 (51) | .091 | .83 | .09 |
| Two factors | 483.73 (50) | .075 | .89 | .05 |
| Between level | ||||
| One factor | 999.39 (50) | .540 | .47 | .17 |
| Two factors | 899.04 (49) | .526 | .36 | .16 |
| Within level | ||||
| One factor | 597.79 (50) | .085 | .87 | .06 |
| Two factors | 403.67 (49) | .069 | .92 | .05 |
RMSEA = root mean square error of approximation. CFI = comparative fit index; SRMR = standardized root mean square residual.
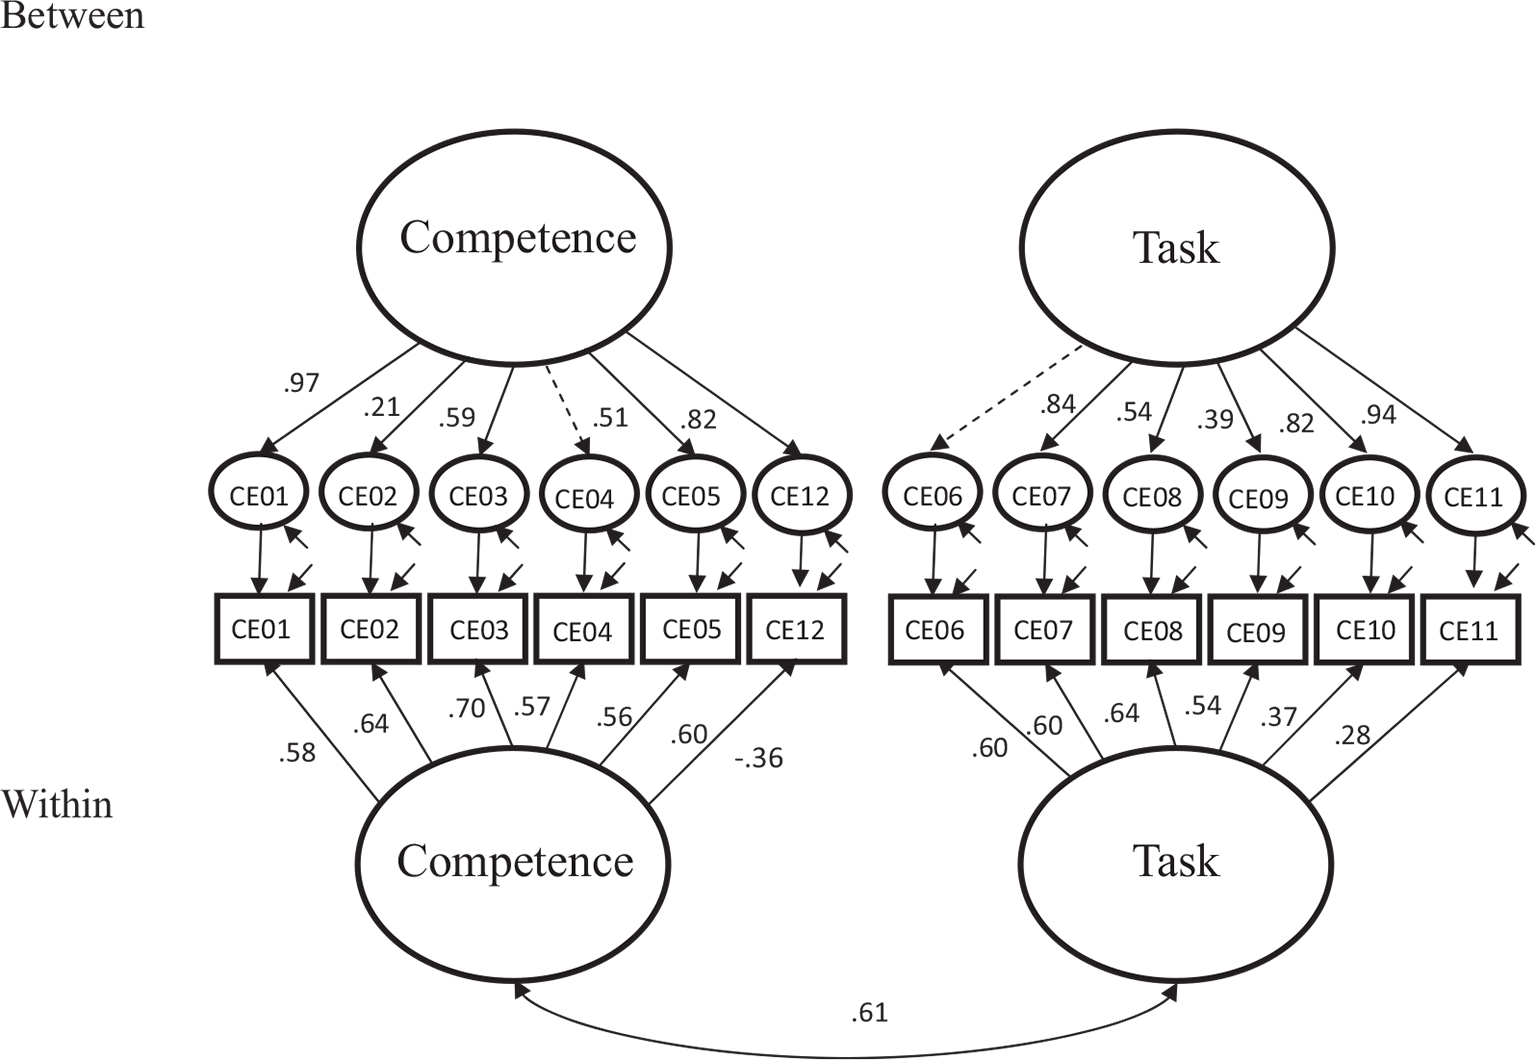
Given the previous results, we next specified a multilevel CFA model to evaluate a two-factor model at both levels. Initially, results showed that the model fit was outside the acceptable range (x2 (106) = 956.24, p < .001; RMSEA = .073; CFI = .80). Inspections of modification indices (MI) did, however, suggest several residual covariances at the within level (CE01 and CE02, CE10 and CE11, CE09 and CE07). These corresponded to the strongly connected item pairs in the network model and were included based on substantial content overlap (see Table 2). In addition, at the between level, findings revealed that item 4 (p = .21) and item 6 (p = .18) did not load significantly on the competence factor and that the task and competence factors were unrelated (r = .27, p = .35). The modified model depicted in Figure 2 showed an acceptable fit (x2 (105) = 530.10, p < .001; RMSEA = .052; CFI = .90), but the SRMR values reported at the within- (0.048) and between levels (0.409) clearly indicate that the model fits better at the individual level than at the school level.
The Influence of Demographic Characteristics
Given that the multilevel results showed a non-optimal solution at the between-level, we chose to investigate the influence of demographic characteristics on CTE using the total data set and ignoring the multilevel structure. Still, we ran analyses considering teachers being nested within schools (i.e., Type = Complex). The variables school size, teaching level, teacher gender (male = 1), teacher age, workload, and years of work experience were all regressed on the factors task and competence. Results showed that both school size and workload were non-significantly related to the factors. Perceptions of group competence were, however, significantly related to teacher age (β = .17, p < .001), teacher gender (β = .06, p < .05), and years of experience as a teacher (β = –.10, p < .05). The task factor was significantly related to teacher age (β = .14, p < .001) and teaching level (β = –.14, p < .001).
Criterion Validity
Criterion validity was investigated by inspecting the strengths and directions of the correlations between academic achievement and problem behavior in school and the CTE total score, task, and competence. Table 4 provides the correlations between the variables concurrently (concurrent validity) and over time (predictive validity). Overall, the results show that the CTE was positively associated with the academic level in class but negatively associated with academic differences in class and level of problem behavior in school (r = –.18, – .23, p < .001). The same pattern emerged over time, but the strengths of the associations were somewhat lower (r = –.15, –.22, p < .001). Interestingly, the task factor consistently showed higher correlations with academic level, academic differences, and less serious problem behaviors compared with the group factor. However, both factors showed significant correlations with academic achievement and problem behavior in the expected directions. Overall, the results provide evidence of concurrent and predictive validity, that is, criterion validity.
Discussion
The present paper aimed to investigate the psychometric properties of the CTE-12 in terms of construct and criterion validity. The present study is, to our knowledge, the first to investigate the CTE-12 in a Scandinavian context as represented by Norway and to consider the network of items. In addition, we wanted to shed light on the demographic characteristics influencing CTE. Overall, the network showed positive associations between the CTE items.
| 1 | 2 | 3 | 4 | 5 | 6 | 7 | 8 | 9 | 10 | |
|---|---|---|---|---|---|---|---|---|---|---|
| 1. ∑CTE | – | |||||||||
| 2. Group factor | .87** | – | ||||||||
| 3. Task factor | .83** | .45** | – | |||||||
| 4. Academic achievements_T1 | .23** | .10** | .29** | – | ||||||
| 5. Academic differences_T1 | –.18** | –.10** | –.22** | –.45** | – | |||||
| 6. Less problem behaviors_T1 | –.23** | –.19** | –.20** | –.31** | .38** | – | ||||
| 7. Serious problem behaviors_T1 | –.18** | –.16** | –.15** | –.15** | .23** | .60** | – | |||
| 8. Academic achievements _T2 | .22** | .10** | .29** | .54** | –.29** | –.19** | –.08* | – | ||
| 9. Academic differences _T2 | –.15** | –.10** | –.17** | –.27** | .55** | .24** | .12** | –.46** | – | |
| 10. Less problem behaviors _T2 | –.19** | –.16** | –.18** | –.18** | .24** | .53** | .41** | –.30** | .34** | – |
| 11. Serious problem behaviors_T2 | –.16** | –.14** | –.14** | –.17** | .16** | .39** | .40** | –.23** | .23** | .67** |
**p < 0.01, * p < 0.05
Strong associations emerged between the following nodes: “Teachers in this school are able to get through to difficult students” and “Teachers here are confident they will be able to motivate their students”; “Learning is more difficult at this school because students are worried about their safety” and “Drug and alcohol abuse in the community make learning difficult for students here”; and between “Home life provides so many advantages the students here are bound to learn” and “The opportunities in this community help ensure that these students will learn.” The items reflect aspects of motivation, a safe school environment, and support from family/community and tend to co-occur in the evolution of CTE-12. These findings indicate that not only are these items important to the definition of CTE as a construct, but they can also be essential to focus on in interventions to promote collective efficacy in school. In addition, the locations of items in the network confirm that the group and task items cluster together.
The results of the single-level CFAs supported a two-factor solution across the twelve items, reflecting task and competence. This two-factor solution is in accordance with several other studies (e.g., Fives & Looney, 2009; Goddard et al., 2004). The multilevel model revealed that this bipartite structure provided the best model fit at the within-school level, whereas several caveats were present for the between-school level. Two items (4 and 6) did not load significantly on the intended factors; in addition, task and competence were unrelated. The SRMR value for the between-level solution was far from optimal, suggesting that the CTE-12 is best considered when used at an individual school level. The ICCs showed that only 4–18% of the variance in CTE items derived from between-school variation; that is, the majority of the variance in items was located within schools. These results mirror findings reported by McCoach and Colbert (2010).
Furthermore, the results suggest that school size and workload are robust characteristics unrelated to CTE. Older teachers evaluated both collective task and competence higher than their younger counterparts did. This finding probably reflects that experience as a teacher results in higher perceived abilities or trust in the collegium’s potential to reach effectively out to all students. In addition, male teachers reported somewhat higher group competence than female teachers, and group competence was evaluated as lower among those teachers reporting more years of experience as a teacher. One explanation may be that over time, teachers work more independently, resulting in lower evaluations of teachers’ joint group capabilities. Unexpectedly, teaching level also related negatively with task; teachers in lower grades evaluated higher levels of task. It is possible that the effects of external factors on teachers’ ability to give instructions are more prominent in the early student years and become more segmented as the students grow older. Another explanation may be that teachers in higher grades cooperate less with each other compared to teachers in lower grades, perhaps because there is less tradition or culture for collaboration. It may also be that because older students are often more challenging and teaching them is more demanding, the teachers in higher grades do not prioritize using time on collaboration with colleagues. Finally, the results confirmed the wide impact of CTE, revealing significant associations with both academic outcomes and school problem behavior. These results correspond well with prior findings (e.g., Donohoo et al., 2018; Eells, 2011; Goddard, 2001; Sørlie & Torsheim, 2011).
All correlations were in the expected direction, both concurrently and over time; that is, CTE was associated positively with the academic achievement level in class and negatively with academic differences in class and the occurrence of more and less serious problem behaviors in school. Although the correlations were small, they were consistent and significant across the various criterion variables, which provided evidence of concurrent and predictive validity.
Strengths and Limitations
The present study has several strengths and limitations. Foremost and for the first time, the psychometric properties of CTE-12 were evaluated in a Scandinavian context (Norway), using a large sample randomly invited to participate in the study, a sample with different demographic characteristics and a sample most likely representative of Norwegian primary schools. Although only one significant group difference between the study sample and the average Norwegian school was identified at baseline, we cannot rule out the chances of differences in unmeasured variables related to the outcomes. The reliability of the measurement for assessing serious problem behavior in school was low, suggesting that this instrument should be improved. In this study, students’ academic achievement and school problem behavior were deliberately and reliably measured at the group level (i.e., class level) rather than at the individual level, implying that these variables, just as the CTE variable, were measured and analyzed as a group attribute and not as an individual attribute. We see this congruence in measurement level as a strength of the study while others may object that more traditionally used measures of academic achievement and behavior problems, such as academic and psychological test scores, could have given more precise estimates.
Furthermore, since we only studied cross-sectional CTE-12 data, we cannot determine the stability of this construct over time or draw conclusions about cause or effect; that is, whether collective efficacy in school induces problem behaviors and academic achievement among students or whether it is the other way around. Finally, the single-rater approach, using teachers as the only informant group, may have increased the probability of inflated relationships between the independent and dependent variables.
Conclusion
Overall, the present study provides insights into the psychometric properties of the short Collective Teacher Efficacy Scale (Goddard, 2002). The results indicate that the CTE-12 is best considered as a construct consisting of two separate but related dimensions: task and competence. However, in this study, the bipartite solution was best conceptualized at the individual school level. From the results, it also appears that demographic characteristics have an impact on how CTE is evaluated. Thus, it should be kept in mind that demographic factors related to both school and teacher influence the evaluation of CTE. The study should, however, be replicated in other Nordic countries (e.g., Sweden, Denmark, Finland or Iceland) to establish more sound conclusions about the validity of CTE-12 when used in Scandinavia. Meanwhile, we propose that the CTE-12 scale is useful for measuring collective efficacy among teachers and relates to both academic achievement and problem behavior in the Norwegian school context.
REFERENCES
- Adams, C. M. & Forsyth, P. B. (2006). Proximate sources of collective teacher efficacy. Journal of Educational Administration, 44(6), 625–642. https://doi.org/10.1108/09578230610704828
- Allinder, R. M. (1994). The relationship between efficacy and the instructional practices of special education teachers and consultants. Teacher Education and Special Education, 17(2), 86–95. https://doi.org/10.1177/088840649401700203
- Bandura, A. (1986). Social foundations of thought and action: A social cognitive theory. Prentice Hall.
- Bandura, A. (1993). Perceived self-efficacy in cognitive development and functioning. Educational Psychologist, 28, 117–148. https://doi.org/10.1207/s15326985ep2802_3
- Bandura, A. (1997). Self-efficacy: The exercise of control. Freeman.
- Borsboom, D. & Cramer, A. O. J. (2013). Network analysis: An integrative approach to the structure of psychopathology. Annual Review of Clinical Psychology, 9, 91–121. https://doi.org/10.1146/annurev-clinpsy-050212-185608
- Costantini, G., Epskamp, S., Borsboom, D., Perugini, M., Mõttus, R., Waldorp, L. J., & Cramer, A. O. B. (2015). State of the aRt personality research: A tutorial on network analysis of personality data in R. Journal of Research in Personality, 54, 13–29. http://dx.doi.org/10.1016/j.jrp.2014.07.003
- De Schryver, M., Vindevogel, S., Rasmussen, A. E., & Cramer, A. O. J. (2015). Unpacking constructs: A network approach for studying war exposure, daily stressors and post-traumatic stress disorder. Frontiers in Psychology, 6. https://doi.org/10.3389/fpsyg.2015.01896
- Donohoo, J., Hattie, J., & Eells, R. (2018). The power of collective efficacy. Educational Leadership, 75(6), 40–44.
- Donohoo, J., O’Leary, T. & Hattie, J. (2020). The design and validation of the enabling conditions for collective teacher efficacy scale (EC-CTES). Journal of Professional Capital and Community, 5(2), 147–166. https://doi.org/10.1108/jpcc-08-2019-0020
- Dussault, M., Payette, D., & Leroux, M. (2008). Principals’ transformational leadership and teachers’ collective efficacy. Psychological Reports, 102(2), 401–410. https://doi.org/10.2466/pr0.102.2.401-410
- Eells, R. J. (2011). Meta-analysis of the relationship between collective teacher efficacy and student achievement (Ph.D. Dissertation). Loyola University.
- Fives, H. & Looney, L. (2009). College instructors’ sense of teaching and collective efficacy. International Journal of Teaching and Learning in Higher Education, 20(2), 182–191.
- Friedman, I. A. & Farber, B. A. (1992). Professional self-concept as a predictor of teacher burnout. The Journal of Educational Research, 86(1), 28–35. https://doi.org/10.1080/00220671.1992.9941824
- Goddard, R. D. (2001). Collective efficacy: A neglected construct in the study of schools and student achievement. Journal of Educational Psychology, 93(3), 467–476. https://doi.org/10.1037/0022-0663.93.3.467
- Goddard, R. (2002). A theoretical and empirical analysis of the measurement of collective efficacy: The development of a short form. Educational and Psychological Measurement, 62(1), 97–110. https://doi.org/10.1177/0013164402062001007
- Goddard, R. D., Hoy, W. K., & Hoy, A. W. (2000). Collective teacher efficacy: Its meaning, measure, and impact on student achievement. American Educational Research Journal, 37(2), 479–507. https://doi.org/10.3102/00028312037002479
- Goddard, R. D., Hoy, W. K., & Hoy, A. W. (2004). Collective efficacy beliefs: Theoretical developments, empirical evidence, and future directions. Educational Researcher, 33(3), 3–13. https://doi.org/10.3102/0013189x033003003
- Goddard, R. D. & Skrla, L. (2006). The influence of school social composition on teachers’ collective efficacy beliefs. Educational Administration Quarterly, 42(2), 216–235. https://doi.org/10.1177/0013161x05285984
- Grey, J. & Sime, N. (1989). Findings from the national survey of teachers in England and Wales. Department of education and science and the Welsh office. London, Her Majesty’s stationary office.
- Guyon, H., Falissard, B., & Kop, J.-L. (2017). Modeling psychological attributes in psychology – an epistemological discussion: Network analysis vs. latent variables. Frontiers in Psychology, 8, 798. https://doi.org/10.3389/fpsyg.2017.00798
- Hattie, J. A. C. (2012). Visible learning for teachers. Maximizing impact on achievement. Routledge.
- Hu, L. T. & Bentler, P. M. (1999). Cutoff criteria for fit indexes in covariance structure analysis: Conventional criteria versus new alternatives. Structural Equation Modeling: A Multidisciplinary Journal, 6(1), 1–55. https://doi.org/10.1080/10705519909540118
- JASP. (2019). Computer software version 0.11.1. The JASP Team. https://jasp-stats.org/
- Kline, R. B. (2011). Convergence of structural equation modeling and multilevel modeling. In M. Williams & W. P. Vogt (Eds.), The Sage handbook of innovation in social research methods (pp. 562–589). Sage Publications Ltd. https://dx.doi.org/10.4135/9781446268261
- Maqbool, S. (2017). Interrelationship between collective teacher efficacy and job satisfaction of teachers at secondary schools. NUML Journal of Critical Inquiry, 15(1), 180–196, XIII. https://doi.org/10.1787/9789264196261-table244-en
- Marsh, H. W., Martin, A. J., & Cheng, J. H. (2008). A multilevel perspective on gender in classroom motivation and climate: Potential benefits of male teachers for boys? Journal of Educational Psychology, 100(1), 78–95. https://doi.org/10.1037/0022-0663.100.1.78
- Midgley, C., Feldlaufer, H., & Eccles, J. S. (1989). Change in teacher efficacy and student self- and task-related beliefs in mathematics during the transition to junior high school. Journal of Educational Psychology, 81(2), 247–258. https://doi.org/10.1037/0022-0663.81.2.247
- Moolenaar, N. M., Sleegers, P. J., & Daly, A. J. (2012). Teaming up: Linking collaboration networks, collective efficacy, and student achievement. Teaching and Teacher Education, 28(2), 251–262. https://doi.org/10.1016/j.tate.2011.10.001
- Muijs, D. & Reynolds, D. (2002). Teachers’ beliefs and behaviors: What really matters? The Journal of Classroom Interaction, 37(2), 3–15.
- Musca, S. C., Kamiejski, R., Nugier, A., Méot, A., Er-Rafiy, A., & Brauer, M. (2011). Data with hierarchical structure: Impact of intraclass correlation and sample size on type-I error. Frontiers in Psychology, 2, 1–6. https://doi.org/10.3389/fpsyg.2011.00074
- Ninković, S. R. & Knežević Florić, O. Č. (2018). Transformational school leadership and teacher self-efficacy as predictors of perceived collective teacher efficacy. Educational Management Administration & Leadership, 46(1), 49–64. https://doi.org/10.1177/1741143216665842
- Ogden, T. (1998). Elevatferd og læringsmiljø: Læreres erfaringer med og syn på elevatferd og læringsmiljø i grunnskolen [Student behaviour and learning climate: Teachers’ experiences and perspectives on student behaviour and learning climate in compulsory school]. Kirke-, utdannings- og forskningsdepartementet.
- Ross, J. A., Hogaboam-Gray, A., & Gray, P. (2004). Prior student achievement, collaborative school processes, and collective teacher efficacy. Leadership and Policy in Schools, 3(3), 163–188. https://doi.org/10.1080/15700760490503689
- Statistics Norway. (2009a). Education statistics. Primary and lower secondary schools. http://www.ssb.no/english/subjects/04/02/20/utgrs_en/tab-2009-04-29-05-en.html
- Statistics Norway. (2009b). Focus on education. Key figures 2008/09. http://www.ssb.no/english/subjects/04/utdanning_tema_en/
- Sørlie, M.-A. & Ogden, T. (2014). Reducing threats to validity by design in a non-randomized experiment of a school-wide prevention model. International Journal of School and Educational Psychology, 2(4), 235–246. https://doi.org/10.1080/21683603.2014.881309
- Sørlie, M.-A. & Torsheim, T. (2011). Multilevel analysis of the relationship between teacher collective efficacy and problem behaviour in school. School Effectiveness and School Improvement, 22(2), 175–191. https://doi.org/10.1080/09243453.2011.563074
- Tschannen-Moran, M., Hoy, A. W., & Hoy, W. K. (1998). Teacher efficacy: Its meaning and measure. Review of Educational Research, 68(2), 202–248. https://doi.org/10.3102/00028312037002479