Introduction
In Sweden, there has been some debate whether there is a need to worry that increasing school segregation in compulsory schools (Holmlund et al., 2014; Bäckström, 2015; Skolverket, 2018) may lead to increased negative peer effects for some pupils, whilst leading to positive peer effects for others, thereby increasing differences in performance between pupils and schools. The Swedish National Agency for Education (Skolverket) has hypothesized that increased peer effects, caused by increased segregation, could explain some of the Swedish decline in results in international tests such as PISA and TIMSS (Skolverket, 2009). Such a claim has been challenged both by researchers (Gilljam & Persson, 2010) and in the political debate (Heller-Sahlgren, 2015). One argument, also recognised by Skolverket (2009), is that there is a lack of Swedish research into the field of peer effects.
The latter might be true to some extent, but I argue that such an argument disregards extensive educational research into “compositional” or “contextual” effects in education (Dreeben & Barr, 1988), which reports evidence on the effects of class composition on student’s results (Rutter & Maughan, 2002). I argue that such effects should be viewed as synonymous to peer effects (Wilkinson, 2002), since the mechanisms that create these effects are a result of the dynamics of the teaching process and the interaction between students, the class and the teacher (Wilkinson, Parr, Fung, Hattie & Townsend, 2002; Thrupp, Lauder & Robinson, 2002; Weinert, Schrader & Helmke, 1989). The relationship between class composition (peers), the teaching process and students’ results was the central theme of Swedish educational research during the 1960’s and 1970’s (Dahllöf, 1967; Lundgren, 1972; Marklund, 1985), which to some extent contradicts the claim that there is a lack of Swedish research into peer effects.
Some researchers have argued that one important mechanism creating peer effects is disruptive classroom behaviour (Lazear, 2001; Blatchford, Edmonds & Martin, 2003; Lavy, Paserman & Schlosser, 2011). In my forthcoming research, I will test whether Ulf P. Lundgren’s specification of the frame factor theory can be used to explain peer effects in education, where disruptive classroom behaviour is one of the factors creating peer effects. In this study, I examine the possible relationship between disruptive classroom behaviour, school composition and students’ outcomes in the Swedish setting, following previous studies by Lavy and Schlosser (2007) and Lavy, Paserman and Schlosser (2011). This study sets the stage for a planned future revisit to the frame factor theory.
Previous research
In the international literature, there is evidence for several different hypotheses about peer effects. For instance, Schindler Rangvid (2003) reports evidence for a positive linear peer effect using Danish PISA data; attending a school with a higher share of high-performing peers increases the individual’s results. In her analysis Schindler Rangvid also finds evidence for a non-linear peer effect since the positive effects of high-achieving peers is greater for low-achieving peers than for high-achieving. The size of the effects diminishes the further up in the achievement distribution she looks.
Similar results have been reported in several other studies (Hoxby, 2000; Hanushek, Kain, Markman & Rivkin, 2003; Sirin, 2005; Ammermueller & Pischke, 2009; Burke & Sass, 2013; Brunello & Rocco, 2013), including Sweden (Szulkin & Jonsson, 2007; Sund, 2009). The effect sizes and type of hypothesis supported empirically (linear/non-linear-, positive/negative peer effect) differs between the studies mainly because of study design, methods used and hypotheses made. There are also other differences. For instance, some studies indicate that the more detailed the independent variables measured, the greater the effect sizes are (Ewijk & Sleegers, 2010; Sirin, 2005; Gustafsson & Yang Hansen, 2018). Other studies indicate that the more controls performed for school, class or teacher fixed effects, the smaller the effect sizes are (Burke & Sass, 2013; Boucher, Bramoullé, Djebbari & Fortin, 2014), or even that they may be non-existent (Vigdor & Nechyba, 2007).
A commonality between the studies mentioned is that all of them are studies in economics or educational economy. The question of peer effects though, is in no way neglected in educational research. The question at hand – how different classmates influence each other – has a long history in the educational sciences, with many researchers pointing to the Coleman report as a starting point (Coleman et al., 1966; Barr & Dreeben, 1977; Rutter & Maughan, 2002). The educational research though, is rarely labelled as research into “peer effects”. It is more commonly referred to as research into “compositional” or “contextual” effects (Dreeben & Barr, 1988).
The educational research has reported similar results to those referred to above (Barr & Dreeben, 1977; Beckerman & Good, 1981; Weinert, Schrader & Helmke, 1989; Bourke, 1986), but with some differences. One important difference that needs to be addressed is which theoretical framework was used to interpret the results and how this may have influenced possible conclusions concerning mechanisms that generate peer effects (see for example Bourke, 1986; Parkerson, Lomax, Schiller & Walberg, 1984).
In the economic literature, it is common to distinguish exogenous factors from endogenous factors (Epple & Romano, 2011). Much of the economic research referred to above uses exogenous factors as independent variables in the analysis. These factors are measured with different types of registered data of the pupils’ socio-economic status (SES), including parents’ educational background and different measures of their immigration background. Hereby the studies de facto say very little about possible casual mechanisms creating the peer effects observed. Why does a larger share of male classmates or a larger share of classmates with highly educated parents influence an individual students’ results?
The other way to study possible peer effects is to use endogenous factors as independent variables in the analysis (Yeung & Nguyen-Hoang, 2016). These differ in the sense that they, firstly, are often viewed as being dependent of the exogenous factors mentioned above,1 and secondly that they are measures of what individuals do, how they act in the classroom, how they behave and how they perform. The first are often measured with surveys or observations, the second – performance – with aptitude tests or registered data on grades. In comparison to exogenous factors, the casual effect of these types of factors is more intuitive. If some classmates disrupt instruction or make a lot of noise, it will likely affect the other students in the class. An example of research dealing with these types of causal mechanisms, with a described causal relationship between exogenous and endogenous factors, and students’ results, is found in Bourke (1986).
In this study, I will focus on the possible effects of disruptive classroom behaviour on students’ results, as well as explore the possible relationship between such exogenous and endogenous factors. It is likely that these factors are correlated to some extent. Exploring and specifying these relationships will contribute to future research in the field.
In Nordic educational research, there are examples of studies of disruptive classroom behaviour (Duesund & Oedegaard, 2018; Bru, 2006). There are also studies of the impact of disruptive classroom behaviour on student’s results, reporting a negative effect of disruptive classroom behaviour (Kristoffersen, Krægpøth, Skyt Nielsen & Simonsen, 2015; Smith & Reimer, 2018). In Sweden, there is a lack of such studies.
In the international literature on peer effects, there are also studies which report on the negative effects of disruptive behaviour. One such example is Lavy and Schlosser (2007) who study Israeli primary- and upper secondary schools. They find evidence that a larger share of girls in a class leads to positive peer effects for all students in the class due to its negative correlation with disruptive behaviour in the classroom instruction.2 The more girls there are in the class, the less disruptive behaviour (Bertrand & Pan, 2013). The effects of a larger share of girls is equal between boys and girls; they all benefit from going to school with a larger share of girls. The results also indicate that a larger share of girls is correlated with less violence in the classroom, improved pupil-to-pupil and pupil-to-teacher relations, enhanced school experiences and decreased teachers’ fatigue. The study doesn’t show whether girls and boys change their behaviour with respect to a larger or smaller share of boys, thereby the effect seems to arise from class composition (Lavy, Paserman & Schlosser, 2011; Lazear, 2001; Cheema & Kitsantas, 2014).
The Frame Factor Theory
Many of the studies referred to thus far, share a focus on the immediate peer effect on an individual students’ results, not how possible peer effects arise from the interaction between class composition, pupil-pupil interactions, and teacher-pupil interactions. In contrast, this study employs Ulf P. Lundgren’s specification of the frame factor theory, which focuses on the interaction between the group (the class) and the teaching process (Haertel, Walberg & Weinstein, 1983).
The discussion of the mechanisms behind peer effects strikes at the heart of the frame factor theory as put forward by Lundgren (1972). The centre of attention is the instruction time needed for students to learn the curricula unit at hand, a concept first introduced by John Carroll in his model of school learning in 1963 (Caroll, 1963; 1989; Haertel, Walberg & Weinstein, 1983), and further developed by Urban Dahllöf into early versions of the frame factor model (Dahllöf, 1967, 1999).
According to Lundgren’s frame factor theory, three main frame factors steer and limit the teaching process. These are (i) the curriculum (the goals and content), (ii) the time available for instruction and (iii) the class composition, more precisely what amount of time the class needs to achieve the goals of the curriculum. If (iii) is greater than (ii), then it will have a negative effect on the outcome (students’ results). According to Lundgren, this also means that in classes with a larger share of low-performing students, the teacher must spend more instruction time on elementary units in the curricula, at the expense of more advanced units.
In his thesis, Lundgren (1972) tests this theory empirically, finding evidence to support it. Lundgren’s frame factor theory does not (at least explicitly) focus on the possible effects of peers’ behaviour. He does mention the correlations in his data between students’ academic abilities and the occurrence of disruptive behaviour, and how this might steal time for instruction, but the theory focusses on academic skills and the time students need to learn the curricula unit at hand.
Other theories, such as Benjamin Bloom’s theory on mastery learning, which also originates from Carroll’s model of school learning, put greater emphasis on how time at hand for instruction is spent, in relation to the time different students need to learn the curricula unit at hand. In this research the concept of “time-on-task” is significant; the more time students spend on task, the more they will learn. In this perspective, disruptive classroom behaviour will lead to time-off-task, thereby leading to poorer results for the students (Bloom, 1974; Arlin, 1979; Karweit, 1984; Karweit & Slavin, 1982; Carroll, 1989).
From the late 1970’s until the present day, major strides have been made in developing the frame factor theory. Early expansions of the theory were made by Lundgren himself, with the intention of creating a broader social theory (Broady, 1999; Englund, 1990), but the contributions from others have been immense. Development of the theory has been characterized by a continuous broadening of the theory (with social and historical perspectives) and with a growing number of frame factors in the analysis (Rapp, Segolsson & Kroksmark, 2017; Persson, 2015; Öberg, 2019).
In the present study, I set the stage for a future revisit to Lundgren’s original frame factor theory (1972) as a way of explaining the mechanisms that create some of the peer effects. Since disruptive classroom behaviour steals time from instruction, I believe that this aspect must be included in a frame factor analysis of the mechanisms of peer effects. Here, I therefore explore whether disruptive classroom behaviour affects students’ results.
The research questions
The aim of this study is to examine the possible relationship between disruptive classroom behaviour and students’ outcomes on the school level in Sweden. Hence, I will investigate whether similar results as reported by Lavy & Schlosser (2007) and Lavy, Paserman & Schlosser (2011) can be found in Swedish lower secondary schools.
Since analysis of these outcomes is also determined by a school’s pupil composition (measured as SES, sex and immigration background), the study will also explore the relationship between these exogenous factors and the endogenous factor of disruptive classroom behaviour.
My research questions for the study are:
(1) What is the relationship between pupil composition (i.e. SES, sex and immigration background) and disruptive classroom behaviour within Swedish lower secondary schools?
(2) Does disruptive classroom behaviour affect school results?
Method
Data Set and Sample
To conduct the study, I set up a joint dataset with data from the Swedish National Agency for Education (Skolverket) SALSA-database and data from the Swedish Schools Inspectorate (Skolinspektionen) School Survey. The dataset comprises variables on school composition, disruptive classroom behaviour and school results. All data is accessible through each authority’s webpage.
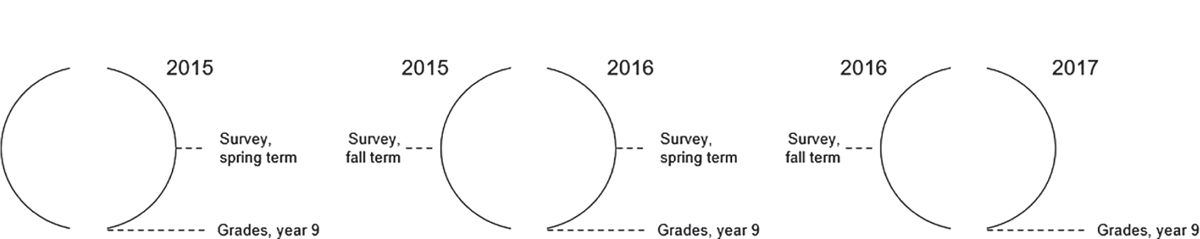
Each term the Swedish Schools Inspectorate conducts a survey amongst pupils, teachers and parents as part of their supervision and quality assurance of Swedish schools. Over a period of four terms (two years, 2015 and 2016), they surveyed all Swedish lower secondary schools (one fourth of the schools each term). The pupils surveyed were in year nine and on average fifteen years old. The pupil surveys had an average response rate of 80% and the teacher surveys 69%. In total 81 816 pupils and 33 629 teachers in 1704 schools answered the surveys (see table 2).
The data from the pupils and teachers’ surveys have been merged with data from the Swedish National Agency for Education SALSA-database, comprising variables of the pupil composition at the school level (year 9) and their results. The data sources are matched by the unique school codes that Sweden employs for statistical use. The survey data from the fall and spring term were merged with the corresponding grades from the end of that school year, as illustrated in figure 1.
The variables used in the analysis are categorized and presented in table 1. The way in which they were measured is described under “Measures”. Table 3 presents descriptive statistics for the dataset.
| VARIABLE | CATEGORY | SOURCE |
|---|---|---|
| Schools’ grade point average (GPA) | Dependent | Skolverket |
| Parents’ average educational background | Independent (exogenous) | Skolverket |
| Share of newly arrived immigrants at school | Independent (exogenous) | Skolverket |
| Share of boys at school | Independent (exogenous) | Skolverket |
| TEACHER INDEX of classroom environment | Independent (endogenous) | Skolinspektionen |
| PUPIL INDEX of classroom environment* | Independent (endogenous) | Skolinspektionen |
*Note that this variable is not used in the final models, the reason for this is described in the “Missing cases” section
Measures
The outcome variable in this study is the grade point average (GPA) for each school, which can range from 0-320 points. In the Swedish school system grades are given in sixteen subjects on a scale from A-F, where F means that the student has not met the criterions for passing. E means passing with acceptable knowledge and gives 10 grade points. Each step adds 2.5 grade points up to A, which gives 20 points.
The other variables retrieved from the SALSA-database are the (exogenous) independent variables, measuring the composition of pupils at the school level. They comprise measures of parents’ educational background (expressed between 0-3, where 1 represents compulsory school completion, 2 upper secondary and 3 tertiary education), share of boys and share of newly arrived immigrants (defined as pupils who have lived in Sweden for a maximum of four years).
The measures of disruptive classroom behaviour (the endogenous independent variables in table 1) are gathered from School Inspectorate surveys and comprise two indexes, one from the pupil survey and one from the teacher survey. Both indexes measure the classroom environment during instruction and are aggregated at the school level. Each index is calculated from three survey items. The response scale is in the form of a Likert scale, but in four steps, from “Fully agree” (coded as 10) to “Fully disagree” (coded as 0), see table 2. The indexes thereby are expressed as the aggregated mean value of survey item 1-3 for each school. The survey items, their Cronbach Alpha values and how the indexes are calculated, are illustrated in table 2. These measures are based on highly comparable definitions of disruptive behaviour as described in previous research (Duesund & Oedegaard, 2018).
The strong Cronbach Alpha-correlations bare witness of good internal validity within the indexes and reliability in the measures. These conclusions are also supported by the School Inspectorates’ analysis of the surveys over time and in their technical reports (Skolinspektionen, 2016).
| PUPIL INDEX | CLASSROOM ENVIRONMENT DURING INSTRUCTION | = | MEAN ITEM 1-3 | |||||
|---|---|---|---|---|---|---|---|---|
| ITEM 1 | There’s peace and quiet during class so I can focus | Fully agree | 10 | |||||
| ITEM 2 | During instruction other peers disturb the order in class (-) | Partially agree | 6.67 | |||||
| ITEM 3 | My teachers make sure that there’s peace and quiet during class | Partially disagree | 3.33 | |||||
| Fully disagree | 0 | |||||||
| Std. Cronbach Alpha = 0,89 | ||||||||
| TEACHER INDEX | CLASSROOM ENVIRONMENT DURING INSTRUCTION | = | MEAN ITEM 1-3 | |||||
| ITEM 1 | The study environment at school is good | Fully agree | 10 | |||||
| ITEM 2 | Maintaining order during class takes a lot of time from instruction (-) | Partially agree | 6.67 | |||||
| ITEM 3 | My students have peace and quiet during class | Partially disagree | 3.33 | |||||
| Fully disagree | 0 | |||||||
| Std. Cronbach Alpha = 0.94 | ||||||||
| TERM AND YEAR OF SURVEY (Skolinspektionen) | |||||||
|---|---|---|---|---|---|---|---|
| Spring 2015 | Autumn 2015 | Spring 2016 | Autumn 2016 | TOTAL | St. dev | Range | |
| Cases (schools) (n) | 422 | 476 | 408 | 398 | 1 704 | ||
| PUPILS | |||||||
| Total | 23 618 | 28 290 | 24 395 | 25 802 | 102 105 | ||
| Responses | 18 162 | 23 383 | 19 381 | 20 890 | 81 816 | ||
| Response rate (%) | 77% | 83% | 79% | 81% | 80% | ||
| PUPIL INDEX: Classroom environment | 5.38 | 5.31 | 5.33 | 5.33 | 5.33 | 0.86 | 2.38-8.67 |
| Missing cases, PUPIL INDEX* | 79 | 52 | 48 | 43 | 222 | ||
| share (%) | 19% | 11% | 12% | 11% | 13% | ||
| TEACHERS | |||||||
| Total | 11 543 | 13 606 | 11 843 | 11 680 | 48 672 | ||
| Responses | 7 937 | 9 211 | 8 076 | 8 405 | 33 629 | ||
| Response rate (%) | 69% | 68% | 68% | 72% | 69% | ||
| TEACHER INDEX: Classroom environment | 6.98 | 7.00 | 7.06 | 6.84 | 6.94 | 0.89 | 3.50-9.78 |
| Missing cases, TEACHER INDEX* | 127 | 139 | 136 | 128 | 530 | ||
| share (%) | 30% | 29% | 33% | 32% | 31% | ||
| TERM AND YEAR OF GRADES AND DEMOGRAPHICS (Skolverket) | |||||||
| Spr. 2015 | Spr. 2016 | Spr. 2017 | TOTAL | ||||
| Parents’ educational background | 2.24 | 2.28 | 2.27 | 2.26 | 0.24 | 1.32-2.94 | |
| Share of newly arrived immigrants (<4 years) | 5,0% | 4.5% | 8.5% | 5.6% | 7.2% | 0-48% | |
| Share of boys | 52.2% | 51.5% | 53.2% | 52.1% | 9.0% | 15-91% | |
| Grade point average (GPA) | 221.2 | 231.4 | 226.3 | 227.8 | 27.3 | 128-314 | |
* The missing cases are due to the School Inspectorate’s rules for reporting results. They only report results for indexes if (i) at least 65% have responded to the specific survey at the specific school and (ii) that at least five persons have answered the survey.
Missing cases
As table 2 shows, there are missing cases in the dataset mainly due to the rules the School Inspectorate employs to protect respondents’ identities. Adding to that, there are also cases missing due to the merging with the data from the Agency for Education. This is mainly due to the fact that some schools do not report students’ grades in accordance with the Agency’s data reporting rules because they are small specialized schools with too few pupils, or because they have ceased to exist during the year for other reasons.
In all regression analyses missing cases are deleted listwise so that the same cases are represented in every analysis.
To ensure that missing cases within the TEACHER INDEX variable and the PUPIL INDEX variable did not cause problems with bias, an analysis of the missing cases was conducted. The missing cases (from the survey data) were compared with the ones not missing using ANOVA analysis of the variables measuring pupil composition and results, hereby investigating whether schools with more high-achieving pupils, for instance, are more likely to have higher response rates to the surveys. The results are presented in table 4. As shown, there are significant differences between missing and non-missing cases regarding the pupils. Schools with high-achieving pupils tend to have higher response rates to the survey.
In the subsequent regression analysis, this problem was handled by using the TEACHER INDEX as the independent endogenous variable.
| TEACHER INDEX | VALID | SCHOOLS (N) | MISSING | SCHOOLS (N)* | P |
|---|---|---|---|---|---|
| Parents’ educational background | 2.26 | 1 007 | 2.27 | 421 | 0.54 |
| Share of newly arrived immigrants | 5.36 | 1 007 | 6.00 | 421 | 0.12 |
| Share of boys | 52.2 | 1 007 | 51.8 | 421 | 0.52 |
| GPA | 227.1 | 1 007 | 229.30 | 421 | 0.18 |
| PUPIL INDEX | |||||
| Parents’ educational background | 2.27 | 1 311 | 2.16 | 117 | <0.0001 |
| Share of newly arrived immigrants (%) | 5.29 | 1 311 | 8.48 | 117 | <0.0001 |
| Share of boys (%) | 51.9 | 1 311 | 54.5 | 117 | <0.01 |
| GPA | 229.0 | 1 311 | 213.8 | 117 | <0.0001 |
*The remaining 276 schools are those with missing data in Skolverkets’ database, which are thereby not included in the analysis.
Analytic Strategy
To answer the first research question, a descriptive statistical analysis was conducted, including correlation analysis. As mentioned earlier in the theory section, endogenous factors (in this case disruptive classroom behaviour) are often viewed as dependent of exogenous factors. Therefore, I also conducted a multiple regression analysis with disruptive classroom behaviour (variable TEACHER INDEX) as a dependent variable and the exogenous variables of schools’ pupil composition as explanatory variables. Thus, the analysis showed the potential relationship between schools’ pupil composition (exogenous factors) and disruptive behaviour (endogenous factors) for the schools in the sample.
Regarding the second research question, I conducted multiple regression analysis with the schools’ GPA set as the dependent variable. Since all data are at the school level, OLS multivariate regression analysis could be employed (there was no need for multilevel analysis since there was only one level of analysis in the data). All data preparation and analyses were conducted using the SAS Enterprise Guide 7.15.
The main analysis was conducted in two steps using two different models, M1 and M2. In M1, the variables of the schools’ pupil composition were set as the explanatory variables, thereby specifying a traditional SES-model for predicting schools’ results. In M2, the variable of disruptive classroom behaviour (TEACHER INDEX) was added to investigate whether it adds explanatory power to the analysis of the school results.
The outcome of this analysis gave reason to conduct a separate mediation analysis. M2 revealed significant effects of disruptive behaviour on the school results, at the same time as the effects of the schools’ composition decreases, indicating that some of the original effects of school composition were mediated through disruptive classroom behaviour.
Results
Descriptive Analysis
In table 5, the correlations between the independent variables and the outcome variable in the forthcoming regressions are shown. First, the analysis shows that there is a stronger correlation between the TEACHER INDEX of disruptive classroom behaviour and the pupil composition of the school, than with the PUPIL INDEX. For instance, there is a positive correlation of .46 (Pearson R) between average parental educational background at the school level and the teacher assessed classroom environment during instruction. The corresponding correlation for the PUPILS INDEX is .14. Secondly, as expected due to the strong correlation between parents’ educational background and GPA (.76), there is also a positive correlation of .46 between TEACHER INDEX and GPA.
The differences between the PUPIL INDEX and the TEACHER INDEX seem robust. There is no clear-cut answer as to why these differences in the correlations appear. One explanation could be that pupils always assess the statements in the survey items according to their own perceptions. What they assess as sufficient calm and quiet in the classroom environment for them to be able to focus, might be assessed as a disturbing environment from the teachers’ point of view. It is also important to consider the fact that the teachers assess the environment for the whole class while the pupils answer only for themselves.
Concerning the first research question, it is apparent that there are correlations between the schools’ pupil composition and disruptive classroom behaviour at the school level, thereby also showing a relationship between exogenous and endogenous factors.
| ENDOGENOUS FACTORS | EXOGENOUS FACTORS | OUTCOME | ||||
|---|---|---|---|---|---|---|
| PUPIL INDEX (Classr.env) | TEACHER INDEX (Classr.env) | Parents’ EDU | N.A. Immigrants (%) | Boys (%) | GPA | |
| PUPIL INDEX (Classr.env) | 1.00 | |||||
| TEACHER INDEX (Classr.env) | 0.31* | 1.00 | ||||
| Parents’ education | 0.14* | 0.46* | 1.00 | |||
| N.A. Immigrants (%) | 0.00 | -0.32* | -0.53* | 1.,00 | ||
| Boys (%) | -0.03 | -0.16* | -0.11* | 0.10 | 1.00 | |
| GPA | 0.15* | 0.46* | 0.76* | -0.60* | -0.20* | 1.00 |
*p < 0,0001
Regression Results
Table 6 presents the results of a multiple regression analysis with disruptive classroom behaviour (TEACHER INDEX) as the dependent variable and school compositional variables3 as the explanatory variables. The model verifies the strong correlation between average parental educational background and the TEACHER INDEX of classroom environment, even when controlling for the variables share of boys and share of newly arrived immigrants.
In reference to Lavy and Schlossers’ (2007) results in their study of Israeli schools, the model reveals a negative effect of a larger share of boys. Controlling for parental education and share of newly arrived immigrants, the model reveals a negative effect of β = -0.099 at p = 0.001. The model has an F-statistic of p = <0.0001, an adjusted R2 of .22 and tests were conducted for heteroscedasticity and linearity (VIF = <2.5; tolerance = >0.2; Durbin-Watson = 1.973).
Moving on to the second research question, another multiple regression analysis was set up with two models. In M1, a traditional SES model with measures of schools’ pupil composition was specified to explain GPA variance in the schools. In M2, measures of disruptive classroom behaviour (TEACHER INDEX) were added. The results are reported in table 7.
As table 7 shows, the traditional SES-model (M1) explains 62% of the variance in the schools’ GPA (F-statistics at p = <0.0001), with parents’ educational background being the strongest predictor at β = 0.602 at p = <0.0001. Tests were conducted for heteroscedasticity and linearity (VIF = <2.5; tolerance = >0.2; Durbin-Watson = 2.081).
What M2 then reveals is that some of the original effect, mainly of the parents’ educational background and the share of boys, seems to be mediated through disruptive classroom behaviour (TEACHER INDEX). In M2 the effect size (measured as β) of the share of boys decreases by 10%, the parents educational background by 8% and the share of newly arrived immigrants by 4% in comparison to M1. In addition to this, the TEACHER INDEX also seems to be an important predictor of GPA at the school level since the variable has about the same effect size as the share of boys (β = 0.118 at p = <0.0001).
M2 explains 63% of the variance in GPA (F-statistics at p = <0.0001), which in comparison to M1 is not a big improvement (VIF = <2.5; tolerance = >0.2; Durbin-Watson = 2.055).
| VARIABLE | B | SE | β | P |
|---|---|---|---|---|
| Intercept | 4.123 | 0.337 | – | 0.000 |
| Parents’ EDU | 1.476 | 0.124 | 0.397 | 0.000 |
| N.A. IMMIGR | -0.065 | 0.026 | -0.085 | 0.011 |
| Share of boys | -0.009 | 0.003 | -0.099 | 0.001 |
Adj R2 = 0.22
| MODEL | VARIABLE | B | SE | β | P |
|---|---|---|---|---|---|
| M1 | Intercept | 94.097 | 7.333 | – | 0.000 |
| Parents’ EDU | 69.427 | 2.693 | 0.602 | 0.000 | |
| N.A. IMMIGR | -5.745 | 0.559 | -0.240 | 0.000 | |
| Share of boys | -0.336 | 0.059 | -0.113 | 0.000 | |
| M2 | Intercept | 79.077 | 7.755 | – | 0.000 |
| TEACHER INDEX | 3.643 | 0.678 | 0.118 | 0.000 | |
| Parents’ EDU | 64.050 | 2.839 | 0.556 | 0.000 | |
| N.A. IMMIGR | -5.506 | 0.553 | -0.230 | 0.000 | |
| Share of boys | -0.302 | 0.058 | -0.102 | 0.000 |
Adj R2 = 0,62
Adj R2 = 0.63
Mediation Analysis
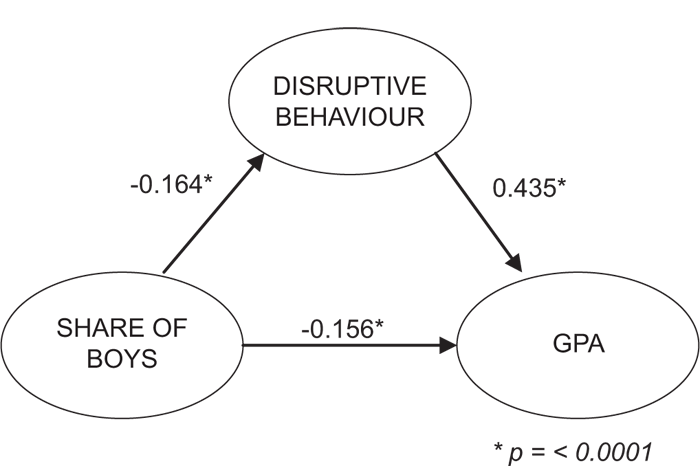
Since the M2 results indicate that some of the original effects of schools’ composition in M1 are mediated through the occurrence of disruptive classroom behaviour (TEACHER INDEX), mediation tests were conducted. In figure 2, the mediation analysis regarding the effects of the share of boys is illustrated in a path diagram. I table 8, the results from each separate mediation analysis is reported. All mediation analyses were tested against the conditions set up by Baron and Kenny (1986), and they were all met. Sobel’s test for significant mediation is reported in table 8.
As the results indicate, some of the original effects from the school compositional variables (SES-variables) are in fact mediated through disruptive classroom behaviour, thereby indicating that there seems to be theoretical relevance carried by the classroom environment in explaining the occurrence of different peer effects.
| DIRECT EFFECT | INDIRECT EFFECT | TOTAL EFFECT | SOBEL’S TEST (P) | |
|---|---|---|---|---|
| Share of boys | -0.156 | -0.,071 | -0.227 | <0.001 |
| Parents’ educational background | 0.680 | 0.068 | 0.748 | <0.001 |
| Share of N.A immigrants | -0.489 | -0.096 | -0.585 | <0.001 |
Conclusions and future research
If the research questions in this study were to be transformed into null-hypotheses, the first null-hypothesis would be that there is no relationship between disruptive classroom behaviour and school compositional variables (measured as students’ SES, sex and immigration background), and the second that disruptive classroom behaviour does not affect school results.
The results indicate that both these null-hypotheses can be rejected. There is a significant relationship between schools’ pupil composition (exogenous variables) and disruptive behaviour (endogenous variables). Disruptive classroom behaviour also affects the schools’ results measured in GPA. The effect is comparable to the reported gender differences between boys and girls (see table 7).
These results are not a replica of those of Lavy and Schlosser (2007), but they do exhibit the same pattern. Disruptive classroom behaviour does affect school results. Similar to the Israeli schools in Lavy and Schlosser’s study, this study reports a correlation between disruptive behaviour and the share of boys in the Swedish lower secondary schools in the sample. Since the present study is not a replica of Lavy and Schlosser, the size of the effect is not comparable.
Considering the distinction made between endogenous and exogenous factors in the economic literature on peer effects, the results of this study provide interesting input. The analysis indicates that some of the original effects of schools’ pupil composition is, in fact, mediated through disruptive classroom behaviour. This means that some of the negative effect that, for instance, the share of boys has on schools’ results, are, in fact, an effect of disruptive classroom behaviour. As shown in table 7, the effect size (measured as β) of the share of boys decreases by 10%, the parents educational background by 8% and the share of newly arrived immigrants by 4% between M1 and M2. Still, the correlations between compositional variables and disruptive behaviour (as reported in table 5), indicate that increased school segregation could lead to increased negative peer effects in negatively segregated schools. Hence, addressing disruptive behaviour could be a strategy for improving schools’ results (Agasisti, Avvisati, Borgonovi, & Longobardi, 2018).
The results are not just statistically significant, they also seem to be theoretically relevant. Recalling Lundgren (1972), the frame factor theory predicts that different classes due to their pupil composition will need different amounts of instruction time for learning specific curricula units. The results of this study indicate that, in addition to a group’s academic prerequisites determining the time needed to achieve curricula goals, the classroom environment also seems to be important to take into account, as this seems to be one of several other factors creating the mechanisms of peer effects. It is of great importance to point out that this study was not conducted using class-level data, which limits the conclusions that are possible to draw. In fact, the school-level data used in this study could result in an underestimation of the true effects of disruptive classroom behaviour since variation in school data is often greater between classes than between schools (Opdenakker & Damme, 2006).
Regarding this issue from a teachers’ perspective enhances the interpretation. Having to spend a lot of time in class maintaining order and ensuring that the classroom environment is appropriate steals time from instruction and generates time-off-task for students (Anderson, 1981; Arlin, 1979). Thereby disruptive classroom behaviour contributes to creating a bigger gap between the instruction time needed by the class and the actual time spent on instruction. Disruptive classroom behaviour is thereby a limiting factor in the teaching process, as predicted by frame factor theory (Lundgren, 1972). The validity of this interpretation seems enhanced by the fact that this issue manifests and is measured in item 2 in the TEACHER INDEX with the survey question “Maintaining order during class takes a lot of time from instruction” (see table 2).
It seems plausible to assume that this effect of disruptive behaviour creates differential effects between high- and low-SES students, as reported in previous research (Schindler Rangvid, 2003); disruptive classroom behaviour is more frequent in low-SES classes, claiming more instructional time from students who need it the most.
There are, of course, important limitations that must be considered given this interpretation of the results. One of the more important is the fact that the survey item mentioned above only measures teachers’ self-assessed effect of maintaining order in class. Observational data might produce different findings.
The results of the study support the view that disruptive classroom behaviour needs to be accounted for in estimating peer effects. As the study was performed using data at the school level, it summons future research to study the true effects on individuals in the Swedish setting using micro-data in a multi-level model.
References
- Agasisti, T., Avvisati, F., Borgonovi, F. & Longobardi, S. (2018). Academic resilience: What schools and countries can do to help disadvataged students succeed in PISA (OECD Working paper no. 167). OECD Publishing.
- Ammermueller, A. & Pischke, J.-S. (2009). Peer effects in European primary schools: Evidence from the progress in international reading literacy study. Journal of Labor Economics, 27(3), 315–348. https://doi.org/10.1086/603650
- Anderson, L. W. (1981). Instruction and time-on-task: A review. Journal of Curriculum Studies, 13(3), 289–303. https://doi.org/10.1080/0022027810130402
- Arlin, M. (1979). Teacher transitions can disrupt time flow in classrooms. American Educational Research Journal, 16(1), 42–56. https://doi.org/10.3102/00028312016001042
- Baron, R. M. & Kenny, D. A. (1986). The moderator-mediator variable distinction in social psychological research: Conceptual, strategic, and statistical considerations. Journal of Personality and Social Psychology, 51(6), 1173–1182. https://doi.org/10.1037//0022-3514.51.6.1173
- Barr, R. & Dreeben, R. (1977). Instruction in classrooms. Review of Research in Education, 5, 89–162. https://doi.org/10.2307/1167173
- Beckerman, T. M. & Good, T. L. (1981). The classroom ratio of high- and low-aptitude students and its effect on achievement. American Educational Research Journal, 18(3), 317–327. https://doi.org/10.3102/00028312018003317
- Bertrand, M. & Pan, J. (2013). The trouble with boys: Social influences and the gender gap in disruptive behavior. American Economic Journal, 5(1), 32–64. https://doi.org/10.1257/app.5.1.32
- Blatchford, P., Edmonds, S. & Martin, C. (2003). Class size, pupil attentiveness and peer relations. British Journal of Educational Psychology, 73(1), 15–36. https://doi.org/10.1348/000709903762869897
- Bloom, B. (1974). Time and learning. American Psychologist, 29(9), 682–688. https://doi.org/10.1037/h0037632
- Boucher, V., Bramoullé, Y., Djebbari, H. & Fortin, B. (2014). Identification of peer effects through social networks. Journal of Applied Econometrics, 29(1), 91–109. https://doi.org/10.1002/jae.2299
- Bourke, S. (1986). How smaller is better: Some relationships between class size, teaching practices, and student achievment. American Educational Research Journal, 23(4), 558–571. https://doi.org/10.3102/00028312023004558
- Broady, D. (1999). Det svenska hos ramfaktorteorin. Pedagogisk Forskning i Sverige, 4(1), 111–121.
- Bru, E. (2006). Factors associated with disruptive behaviour in the classroom. Scandinavian Journal of Educational Research, 50(1), 23–43. https://doi.org/10.1080/00313830500372000
- Brunello, G. & Rocco, L. (2013). The effect of immigration on the school performance of natives: Cross country evidence using PISA test scores. Economics of Education Review, 32, 234–246. https://doi.org/10.1016/j.econedurev.2012.10.006
- Burke, M. A. & Sass, T. R. (2013). Classroom peer effects and student achievement. Journal of Labor Economics, 31(1), 51–82. https://doi.org/10.2139/ssrn.1260882
- Bäckström, P. (2015). Hur påverkar förändrad elevsammansättning elevers resultat? Utbildning & Demokrati, 24(2), 55–72.
- Caroll, J. B. (1963). A model of school learning. Teachers College Record, 64, 723–733.
- Carroll, J. B. (1989). The Carroll Model: A 25-year retrospective and prospective view. Educational Researcher, 18(1), 26–31. https://doi.org/10.3102/0013189x018001026
- Cheema, J. & Kitsantas, A. (2014). Influences of disciplinary classroom climate on high school student self-efficacy and mathematics achievment: A look at gender and racial differences. International Journal of Science and Mathematics Education, 12(5), 1261–1279. https://doi.org/10.1007/s10763-013-9454-4
- Coleman, J. S., Campbell, E. Q., Hobson, C. J., McPartland, J., Mood, A. M., Weinfeld, F. D. & York, R. L. (1966). Equality of educational opportunity. US Department of Health, Education and Welfare.
- Dahllöf, U. (1967). Skoldifferentiering och undervisningsförlopp. Almqvist & Wiksell.
- Dahllöf, U. (1999). Det tidiga ramfaktorteoretiska tänkandet. En tillbakablick. Pedagogisk forskning i Sverige, 4(1), 5–29.
- Dreeben, R. & Barr, R. (1988). Classroom composition and the design of instruction. Sociology of Education, 61(3), 129–142. https://doi.org/10.2307/2112622
- Duesund, L. & Oedegaard, M. (2018). Students’ perceived experience of disruptive behavior in schools. Nordic Studies in Education, 38(2), 138–154. https://doi.org/10.18261/issn.1891-5949-2018-02-04
- Englund, T. (1990). På väg mot en pedagogiskt dynamisk analys av innehållet. Forskning om utbildning, 1, 19–35.
- Epple, D. & Romano, R. (2011). Peer effects in education: A survey of the theory and evidence. In J. Benhabib et al. (Eds.), Handbook of social economics. Elsevier.
- Ewijk, R. v. & Sleegers, P. (2010). The effect of peer socioeconomic status on student achievement: A meta-analysis. Educational Research Review, 5(2), 134–150. https://doi.org/10.1016/j.edurev.2010.02.001
- Gilljam, M. & Persson, M. (2010). Skolforskning med problem. Funderingar kring en rapport om resultaten i svensk grundskola. Pedagogisk forskning i Sverige, 15(4), 279–287.
- Gustafsson, J.-E. & Yang Hansen, K. (2018). Changes in the impact of family education on student educational achievement in Sweden 1988–2014. Scandinavian Journal of Educational Research, 62(5), 719–736. https://doi.org/10.1080/00313831.2017.1306799
- Haertel, G., Walberg, H. & Weinstein, T. (1983). Psychological models of educational performance: A theoretical synthesis of constructs. Review of Educational Research, 53(1), 75–91. https://doi.org/10.2307/1170327
- Hanushek, E. A., Kain, J. F., Markman, J. M. & Rivkin, S. G. (2003). Does peer ability affect student achievement? Journal of Applied Econometrics, 18, 527–544. https://doi.org/10.1002/jae.741
- Heller-Sahlgren, G. (2015). Ett skolpolitiskt villospår. Kamrateffekter och utbildningspolitiska implikationer för Sverige. Timbro.
- Holmlund, H., Häggblom, J., Lindahl, E., Martinson, S., Sjögren, A., Vikman, U. & Öckert, B. (2014). Decentralisering, skolval och fristående skolor: resultat och likvärdighet i svensk skola. Rapport 2014:25. IFAU.
- Hoxby, C. (2000). Peer effects in the classroom: Learning from gender and race variation. NBER Working Paper no.7867.
- Karweit, N. (1984). Time-on-task reconsidered: Synthesis of research on time and learning. Educational Leadership, 41(8), 32–35.
- Karweit, N. & Slavin, R. (1982). Time-on-task: Issues of timing, sampling, and definition. Journal of Educational Psychology, 74(6), 844–851. https://doi.org/10.1037//0022-0663.74.6.844
- Kristoffersen, J. H., Krægpøth, M. V., Skyt Nielsen, H. & Simonsen, M. (2015). Disruptive school peers and student outcomes. Economics of Education Review, 45, 1–13. https://doi.org/10.1016/j.econedurev.2015.01.004
- Lavy, V. M., Paserman, D. & Schlosser, A. (2011). Inside the black box of ability peer effects: Evidence from variation in the proportion of low achievers in the classroom. The Economic Journal, 122, 208–237. https://doi.org/10.1111/j.1468-0297.2011.02463.x
- Lavy, V. & Schlosser, A. (2007). Mechanisms and impacts of gender peer effects at school. NBER. https://doi.org/10.3386/w13292
- Lazear, E. P. (2001). Educational production. The Quarterly Journal of Economics, 116(3), 777–803. https://doi.org/10.1162/00335530152466232
- Lundgren, U. P. (1972). Frame factors and the teaching process. A contribution to curriculum theory and theory on teaching. Göteborgs universitet.
- Marklund, S. (1985). Skolsverige 1950–1975. Del 4. Differentieringsfrågan. Skolöverstyrelsen och Liber Utbildningsförlaget.
- Opdenakker, M.-C. & Damme, J. V. (2006). Differences between secondary schools: A study about school context, group composition, school practice, and school effects with special attention to public and Catholic schools and types of schools. School Effectiveness and School Improvement, 17(1), 87–117. https://doi.org/10.1080/09243450500264457
- Parkerson, J. A., Schiller, D. P., Lomax, R. G. & Walberg, H. J. (1984). Exploring causal models of educational achievement. Journal of Educational Psychology, 76(4), 638–646. doi:10.1037/0022-0663.76.4.638
- Persson, A. (2015). Framed school – frame factors, frames and the dynamics of social interaction in school. Scandinavian Journal of Educational Research, 59(5), 499–514. https://doi.org/10.1080/00313831.2014.932305
- Rapp, S., Segolsson, M. & Kroksmark, T. (2017). The Education Act – conditions for a research-based school: A frame-factor theoretical thinking. International Journal of Research and Education, 2(2). https://doi.org/10.19239/ijrev2n2p1
- Rutter, M. & Maughan, B. (2002). School effectiveness findings 1979–2002. Journal of School Psychology, 40(6), 451–475. https://doi.org/10.1016/s0022-4405(02)00124-3
- Schindler Rangvid, B. (2003). Do schools matter? The influence of school inputs on student performance and outcomes. Aarhus School of Business.
- Sirin, S. R. (2005). Socioeconomic status and academic achievement: A meta-analytic review of research. Review of Educational Research, 75(3), 417–453. https://doi.org/10.3102/00346543075003417
- Skolinspektionen. (2016). Skolenkäten – teknisk rapport. Dnr 2015:7261. Skolinspektionen.
- Skolverket. (2009). Vad påverkar resultaten i svensk grundskola? Skolverket.
- Skolverket. (2018). Analyser av familjebakgrundens betydelse för skolresultaten och skillnader mellan skolor. Rapport 467. Skolverket.
- Smith, E. & Reimer, D. (2018). Klasseledelse, uro og mobning: Resultater fra TIMSS 2011. Nordic Studies in Education, 38(1), 35–51. https://doi.org/10.18261/issn.1891-5949-2018-01-04
- Sund, K. (2009). Estimating peer effects in Swedish high school using school, teacher, and student fixed effects. Economics of Education Review, 28(3), 329–336. https://doi.org/10.1016/j.econedurev.2008.04.003
- Szulkin, R. & Jonsson, J. O. (2007). Ethnic segregation and educational outcomes in Swedish comprehensive schools. SULCIS Working paper 2007:2.
- Thrupp, M., Lauder, H. & Robinson, T. (2002). School composition and peer effects. International Journal of Educational Research, 37, 483–504. https://doi.org/10.1016/S0883-0355(03)00016-8
- Weinert, F. E., Schrader, F. W. & Helmke, A. (1989). Quality of instruction and achievement outcomes. International Journal of Educational Research, 13(8), 895–914. https://doi.org/10.1016/0883-0355(89)90072-4
- Vigdor, J., & Nechyba, T. (2007). Peer effects in North Carolina public schools. In L. Woessmann & P. Peterson (Eds.), Schools and the equal opportunity problem. The MIT Press.
- Wilkinson, I. A. (2002). Introduction: Peer influences on learning: Where are they? International Journal of Educational Research, 37(5), 395–401. https://doi.org/10.1016/s0883-0355(03)00012-0
- Wilkinson, I. A., Parr, J. M., Fung, I. Y., Hattie, J. A. & Townsend, M. A. (2002). Discussion: Modeling and maximizing peer effects in school. International Journal of Educational Research, 37(5), 521–535. https://doi.org/10.1016/s0883-0355(03)00018-1
- Yeung, R. & Nguyen-Hoang, P. (2016). Endogenous peer effects: Fact or fiction? Journal of Educational Research, 109(1), 37–49. https://doi.org/10.1080/00220671.2014.918528
- Öberg, J. (2019). Samhällskunskap från styrdokument till undervisning: Tjugo lärare ramar in vad som påverkar deras praktik. Högskolan för lärande och kommunikation.
Fotnoter
- 1 In many research fields, this relationship also lies in the core-definition of the two terms seen as a dichotomous pair.
- 2 Hereby also illustrating the dependent/independent relationship between exogenous (sex) and endogenous (disruptive behaviour) factors.
- 3 Note that the variable “Share of newly arrived immigrants” has been logged, due to the fact that it is not normally distributed in its original form.