1 Introduction
Across the world, a large share of children spend much of their early years in formal early childhood education and care (ECEC; UNESCO, 2018). As the early childhood environment has a profound influence on outcomes throughout life (Black et al., 2017), the quality of care is an important factor for child development. Although both universal and targeted formal ECEC1 often have beneficial effects on child outcomes, especially for children from disadvantaged backgrounds, studies also show null and harmful effects (Christoffersen, Højen-Sørensen & Laugesen, 2014; Dietrichson, Kristiansen & Viinholt, 2020; McCoy et al., 2017; van Huizen & Plantenga, 2018). Furthermore, early childhood care is often of mediocre quality (Vermeer, van IJzendoorn, Cárcamo & Harrison, 2016). Thus, improving the quality of formal ECEC seems important.
Improving the training of preschool staff provides a promising path to higher-quality care (Egert et al., 2018). Formal qualifications are positively and statistically significantly associated with measures of preschool quality (OECD, 2018a), and pre-service interventions can improve preschool teacher skills (Fukkink, Helmerhorst & Deynoot-Schaub, 2019). However, the level of training of preschool teachers varies widely, and pre-service training has not reliably produced a high-quality preschool environment (Pianta, Barnett, Burchinal & Thornburg, 2009; OECD, 2018a). In-service professional development (PD) of preschool teachers may therefore be necessary to produce high-quality ECEC (Buysse, Winton, & Rous, 2009).
Recent reviews and meta-analyses of in-service PD programs have documented large and beneficial effects on teacher-level and preschool-level outcome measures (Egert et al., 2018; Filges et al., 2019; Markussen-Brown et al., 2017). However, the effects are typically much smaller for child-level measures of, for example, language, preliteracy, and social-emotional skills. Furthermore, when restricting the analysis to standardized and validated tests, and randomized controlled trials (RCTs) and quasi-experimental studies with relatively low risk of bias, the overall evidence of beneficial effects on child outcomes is weak (Filges et al., 2019; note that this review includes both preschool and school teacher PD programs).
In sum, if the ultimate objective of PD is to improve child outcomes (Kennedy, 2016), then the question of how to create effective PD programs remains open.
1.2 Characteristics of professional development programs
High-quality adult-child interactions and caregiving are the strongest predictors of children’s skill development (NICHD Early Child Care Research Network, 2002), and the quality of adult-child interactions is often ranked as the most important factor for ECEC quality (Huntsman, 2008; OECD, 2018a; Sabol, Hong, Pianta & Burchinal, 2013, Zaslow, Tout, Halle, Whittaker & Lavelle, 2010). Improving these interactions is therefore central to PD programs aiming to improve child outcomes (Pianta et al., 2009).
How to design PD programs that improve adult-child interactions is not as well understood. Researchers who have studied both preschool and school PD programs recommend different features. Buysse et al. (2009), Darling-Hammond, Hyler and Gardner (2017), Egert et al. (2018) and Pianta et al. (2009) argue that effective programs tend to focus on specific content, such as a new curriculum or content based on a quality-rating scale. Providing teachers with explicit models in the form of, for example, lesson plans, child and student work samples, observations of peer teachers, and videos or written cases of teaching, may give teachers a clearer vision of best practices (Darling-Hammond et al., 2017; Pianta et al., 2009). Buysse et al. (2009) and Darling-Hammond et al. (2017) argue that coaches, as well as collaboration with and feedback from fellow teachers, facilitate reflection, and help learning. Furthermore, PD that feature collaboration with colleagues provide opportunities for changing organizational practices (Buysse et al., 2009; Darling-Hammond et al., 2017; Zaslow et al., 2010). Some studies posit that to facilitate reflection without losing focus, programs should be intensive and not too short (Buysse et al., 2009, Darling-Hammond et al., 2017; Pianta et al., 2009). Zaslow et al. (2010) argue that the duration and intensity should be tailored to the content of the program (e.g., broader focus and newer content require longer and more intense programs).
The empirical evidence for these proposed effective program components is not clear-cut. For instance, Werner, Linting, Vermeer and Van IJzendoorn (2016) found no association between the duration of interventions and effect sizes. Although Kraft et al. (2018) found positive and significant average effect sizes of coaching school and preschool teachers, effect sizes varied substantially. Kennedy (2016) reported that highly prescriptive programs, i.e. programs explicitly demonstrating pre-specified content, had smaller effects than less prescriptive programs.
The theoretical relation between PD program characteristics and effectiveness is often ambiguous. The diverging empirical results may be explained by a tension between the need for interventions to prescribe content and the importance of motivation for learning (Kennedy, 2016). On the one hand, PD builds on the idea that the participating staff do not fully know best practice. Thus, prescribing some content is necessary. On the other hand, being told what to do – whether by researchers, coaches, or colleagues – may be demotivating if influence and control over organizational changes are important for engagement and motivation (Conner, 2003). Similarly, if the effects of PD programs depend on the participants’ motivation to learn, mandatory assignment of staff to programs may not have much effect on learning (Kennedy, 2016). Finding the right balance between prescription and motivation therefore seems important.
This point also concerns higher levels in the organizational system. Contextual variables such as the workplace environment and organizational support may moderate the effects of PD (Egert et al., 2018; Kennedy, 2016). Support is often crucial for the successful and sustained implementation of changed practices in all types of organizations (Darling-Hammond et al., 2017). Preschools that are forced into a PD program may not have the resources to provide enough organizational support and interventions may have little impact, even if participating teachers and assistants are willing and able to change. The same program may therefore have different effects, depending on the organizational context (Zaslow et al., 2010).
1.3 The contribution of the current study
The previous section suggests that PD programs may be improved if the programs allow participants to participate more and collaborate in the learning process. In a Danish preschool setting, we used a mixed-methods approach to study a PD program that was designed to be participatory and collaborative. Our two main research questions were:
- What are the effects of a participatory PD program on children’s social-emotional, language, and literacy skills?
- Did the PD program change the practices at the participating preschools?
To answer the first research question, we used a cluster-randomized controlled trial where sixteen preschool units in a Danish municipality were randomly assigned to a treatment group (eight units) that received the program and a control group (eight units) that did not (i.e., a treatment-as-usual control). For the second question, we used focus group interviews to examine the participants’ views on the program, the implementation of the program, their own practices, as well as exploratory quantitative analyses of a measure of pedagogical quality. We then collated the quantitative and qualitative results to interpret the effects of the program. Below, we describe the context of ECEC in Denmark, related Danish studies, and then present the program.
1.3.1 Danish context and previous literature
Denmark provides universal ECEC in the sense that all children, regardless of background, can attend preschool provided by the 98 municipalities. Care is also universal in the sense that nearly all children attend preschool for some time during their childhood: the attendance rate for 3 to 5-year-olds was 97–98 percent in 2016 (OECD, 2018b).
The quality of Danish preschools is high compared to most OECD countries, as measured by structural and process quality parameters (OECD, 2018a). Structural characteristics, such as the adult-child ratio, the group size, the staff educational level, and health and safety regulations, may support and facilitate high-quality interactions between children and adults (Christoffersen et al., 2014), which in turn are often seen as the most important influences of ECEC process quality and child development (Bronfenbrenner & Morris, 2006; Sabol et al., 2013). According to a literature review by Nielsen, Tiftikci and Søgaard Larsen (2013), ECEC has positive effects on children’s well-being and social, emotional and cognitive skills when:
- The practitioner is attentive to all children and engages herself in continuous interactions with all children
- The interaction between practitioner and child is based on intersubjectivity, respect and a positive atmosphere
- The practitioner is sensitive and responsive in her interaction with the child
- The practitioner use verbal as well as non-verbal ques to evaluate the situation, the child’s needs and its perspective.
Although these characteristics inform this study, it must be acknowledged that the relational conditions in Danish ECEC are not always favorable and reducing inequalities has proven to be difficult. So, despite the near universal attendance and a strong political focus on equality, a more inclusive pedagogy has not been easy to establish in Danish ECECs (Ringsmose & Svinth, 2019). For example, there are large differences in social-emotional and language skills between high- and low-socioeconomic status (SES) children present in the earliest years of preschool (Ministry for Social Affairs, 2016). These differences remain stable during the preschool years and amount to up to two years’ learning between the average and lowest scoring children at the start of primary school (Ministry for Social Affairs, 2016).
As for the literature in general, the evidence of PD effectiveness in Denmark is also mixed. The two studies that are closest to ours in terms of preschool context and intervention content examined two-year interventions targeting three to six year old children in regular Danish preschools (reported in Jensen, Holm, Allerup & Kragh, 2009; Jensen, Holm & Bremberg, 2013; Jensen, Jensen & Rasmussen, 2013, 2017). The interventions provided workshops and training sessions for preschool staff to improve adult-child interactions. Both studies found beneficial and mostly statistically significant effects on the Strengths and Difficulties Questionnaire (SDQ) and its subscales, which we also used. The effects on language, math, nature, and cultural skills, and learning readiness measures were small, mostly negative, and not significant.
Bleses et al. (2018) studied the effects of three versions of a twenty-week manualized storybook-based intervention on three to six-year-olds in regular Danish preschools. The intervention content differed from our study, but their base intervention featured some PD, and then two enhanced versions featured either extended PD for educators, or a home-based program for parents. Although Bleses et al. found positive effects on the Language Assessment of Children, which we also used, there were no significant differences among the three versions of the intervention. As the intervention included components in addition to PD, including small-group instruction, progress monitoring, and curriculum changes, and extended PD did not significantly increase the effects, it is unclear how much the PD component affected children’s language and preliteracy skills.
1.3.2 The intervention
With inspiration from Nielsen et al. (2013), the main aim of the PD intervention was to improve the quality of adult-child interaction and thereby improve the social-emotional and language skills of, in particular, disadvantaged children. To this end, we collaborated with the preschool administration, teachers, and assistants in a municipality that has one of the largest shares of children from disadvantaged backgrounds in Denmark (see Table 1). Eight preschool units serving children aged three to six years participated in the intervention, while the remaining eight preschool units constituted the control group.
| VARIABLES | TREATMENT | CONTROL | ||||
|---|---|---|---|---|---|---|
| Mean | SD | N/n | Mean | SD | N/n | |
| Child and family characteristics | ||||||
| Girl (average national share = 0.49) | 0.51 | 0.50 | 125 | 0.52 | 0.50 | 171 |
| Mother not born in Denmark (0.20) | 0.21 | 0.41 | 125 | 0.18 | 0.38 | 169 |
| Father not born in Denmark (0.18) | 0.18 | 0.38 | 120 | 0.16 | 0.37 | 159 |
| Mother no high school (0.12) | 0.29 | 0.46 | 114 | 0.32 | 0.47 | 158 |
| Father no high school (0.14) | 0.21 | 0.41 | 116 | 0.27 | 0.45 | 143 |
| Mother employed (0.75) | 0.55 | 0.50 | 116 | 0.55 | 0.50 | 159 |
| Father employed (0.88) | 0.69 | 0.46 | 116 | 0.70 | 0.46 | 150 |
| Mother’s disposable income (254,063 DKK) | 190,400 | 92,938 | 116 | 191,163 | 70,713 | 159 |
| Father’s disposable income (311,822 DKK) | 186,798 | 298,938 | 116 | 199,880 | 98,045 | 150 |
| Pre-intervention measures | ||||||
| Age in years | 3.6 | 0.44 | 125 | 3.6 | 0.43 | 171 |
| SDQTotal | 7.4 | 5.7 | 125 | 8.0 | 6.5 | 171 |
| SDQ Impact | 0.38 | 0.49 | 126 | 0.41 | 0.49 | 167 |
| SDQ Prosocial | 7.4 | 2.4 | 128 | 6.7 | 2.7 | 171 |
| Language total | 35.6 | 30.5 | 75 | 37.0 | 31.9 | 103 |
| KIDS score | 313.5 | 86.6 | 8 | 351.3 | 68.1 | 8 |
| Post-intervention measures | ||||||
| Age in years | 5.5 | 0.45 | 125 | 5.5 | 0.43 | 171 |
| SDQTotal | 6.8 | 5.6 | 125 | 6.2 | 6.2 | 171 |
| SDQ Impact | 0.47 | 0.50 | 126 | 0.36 | 0.48 | 167 |
| SDQ Prosocial | 8.0 | 2.1 | 128 | 8.1 | 1.9 | 171 |
| Language composite | 57.4 | 29.1 | 75 | 55.1 | 32.4 | 103 |
| Preliteracy composite | 42.3 | 28.5 | 71 | 42.5 | 29.0 | 100 |
| KIDS score | 347.6 | 69.9 | 8 | 355.9 | 50.8 | 8 |
Note: Source: Statistics Denmark and own measurements and calculations. For the register data, we used the latest available information, which is from either 2016 or 2017 depending on the variable and the child. N denotes the number of preschool units (i.e., for the KIDS score), and n the number of children. The statistics are for the sample with both a pre- and post-test score on the SDQ, except for the language assessment variables, which are for the sample with both a pre- and post-test score on the LAC. The child and family characteristics are expressed as shares, unless otherwise mentioned. The values in parentheses next to the variable names are the averages for the age group of two to seven year old children in the other 97 municipalities in Denmark.
The intervention consisted of ten workshops (ten full days) spread across approximately one and a half years. Inspired by participatory ECEC projects like “With the child in the center” (Broström, Jensen, Hansen & Svinth, 2016) researchers and practitioners developed the intervention in close collaboration. Through presentations and discussions the intention was to develop explorative and mutually inspiring reflections on the everyday interaction between practitioners and children (Christoffersen et al., 2014). The researchers contributed with state-of-the-art knowledge about high-quality ECEC and its importance for disadvantaged children. The practitioners contributed with examples of challenges in day-to-day practice. Two or three researchers participated in each workshop (the third and fourth author, as well as external lecturers and researchers), and around 24 practitioners participated. With a few exceptions, the same practitioners participated throughout the intervention.
The intervention content was based on a view of child development as a social process, in which learning is the result of the interaction between children and their immediate environment (Vygotsky, 2004). The project was inspired by a Vygotskian view on the qualities of play that emphasizes play as children’s leading and autotelic activity, and focuses on children’s interests and engagement within a Zone of Proximal Development (Aras 2016; Hedges & Cooper, 2018). Theory and research was presented at the workshops, and researchers and practitioners discussed and explored pedagogical practice and social inclusion in light of the research literature. The intervention sought to improve children’s language and social-emotional skills by improving the quality of preschools, an approach that built on research that indicates a connection between preschool quality and children’s skill development (Auger, Farkas, Burchinal, Duncan & Vandell, 2014). A large body of research indicates that children’s cognitive, social, emotional, and motor skills develop when they meet engaged and responsive adults who positively affirm the children’s expressions and feelings using age-appropriate activities (e.g., Bronfenbrenner & Morris, 2006).
Based on the Danish ECEC tradition and sociocultural theory, the workshops primarily aimed to develop playful forms of interaction that engaged both children and adults, and enhanced the children’s active participation in play. Between the workshops, the practitioners worked with around 40 children (focus children) whom the practitioners believed were at risk of developmental difficulties. Participating practitioners also tried to spread the workshop content to other practitioners at their own unit. At the following workshop, the new practices were re-examined using the practitioner’s own video recordings, narratives, short presentations, and collective discussions.
The workshop form and the lack of a set manual provided ample opportunities for practitioners to influence the content of the intervention and to participate on relatively equal terms with the researchers. The participatory form aimed to ground the intervention in the challenges of day-to-day preschool work and ensure that it was meaningful to the practitioners. In turn, the set up aimed to increase the practitioners’ sense of ownership and thereby the chances of producing lasting changes. At the organizational level, not all preschool staff and managers participated in the intervention. Each preschool had two to three representatives in the workshops. Two preschool managers chose to participate throughout the process. The municipality mandated the participation of those units randomized to the treatment group.
2 Methods
2.1 Participants
Preschool teachers and children in fourteen preschools in one Danish municipality participated in the study. Two preschools consisted of two departments at separate geographical locations, which had separate staff and child groups (in both cases they shared a manager). We decided to treat these departments as separate preschool units, and randomized sixteen preschool units to the treatment (eight units) and the control group (eight units). The parents of the participating children were informed about the study and were given the opportunity to decline participation for their children, i.e., informed consent was obtained from the guardians of all participants.
In our primary analysis, we focus on the sample of children using both a pre- and a post-test, similar to Bleses et al. (2018).2 This subset of children potentially experienced the full intervention: they were enrolled and old enough to be tested at pre-test and did not leave preschool for primary school during the intervention.
The SDQ cannot be used for children who are younger than two years and the language assessment is intended for three to six year olds. Danish children typically leave preschool to prepare for primary school in late spring the year they turn six. In the municipality we studied, the “school starters” leave their preschool on April 1. As we conducted the pre-tests before April 1 in 2017, and the post-tests in the spring of 2019, two cohorts of children left preschool between pre- and post-test. These children either did not receive any intervention (the cohort that left in April 2017) or received only parts of the intervention (the cohort that left in April 2018).
Table 1 contains descriptive statistics of our analysis sample. We discuss these statistics and attrition further in the section Treatment and control group balance, after we have presented the outcome measures.
2.2 Quantitative analysis
2.2.1 Child level outcome measures
Our primary outcomes measured children’s social-emotional, language, and preliteracy skills. To collect quantitative data on social-emotional skills, we used the Danish version of the SDQ, which is a 25-item questionnaire designed to assess behavioral, social, and emotional difficulties in children and youths (e.g., Goodman & Goodman, 2009). We used two versions of the questionnaire, one for two to four-year-olds and one for five to six-year-olds. The measure has five subscales: emotional symptoms, conduct problems, hyperactivity, peer problems, and prosocial behavior. Each item is rated on a 3-point Likert scale (0 = not true, 1 = somewhat true, 2 = certainly true). Higher scores on the first four subscales represent more problems and higher scores on the prosocial scale represent more prosocial behavior.
We used the total SDQ score (range 0-40), the prosocial scale (range 0-10), and the first question from the impact supplement as outcome measures. We used the prosocial scale, as it is not included in the total score, which is the summed score on the first four subscales. The total score had overall better psychometric properties than any of the subscales in a recent systematic review of studies that examined the validity and reliability of the SDQ among preschoolers aged three to five years (Kersten et al., 2016).3 The question from the impact supplement asks the rater whether he/she ‘‘overall thinks that the child has difficulties in one or more of the following areas: emotions, concentration, behavior or being able to get on with other people’’ (transformed into a binary measure, impact, where 1 = “yes” and 0 = “no”).
We used two versions of a Danish test, the Language Assessment for Children (LAC), one at pre-test and one at post-test. The post-test version was a newer version of the pre-test version (Bleses, Vach, Jørgensen, & Worm, 2010; Socialstyrelsen, 2017). The tests are used to conduct compulsory language tests in Denmark when children are three (for children in preschool with suspected language difficulties), and in the first year of primary school when children are six (for all children). We used one composite scale as the pre-treatment measure and two composite scales as post-treatment outcome measures, a language composite and a preliteracy composite. The language composite included subscales measuring language comprehension, vocabulary, and communication strategies. The preliteracy composite included subscales measuring rhyme detection, sound discrimination, letter identification, and, for children five years or older, a phoneme deletion scale. The language and preliteracy composites are weighted averages of the subscales, expressed as percentile scores. The percentile scores are based on norm-referenced samples (see Socialstyrelsen, 2017 for details on the norm-referenced samples used for the post-test).4
2.2.2 Pedagogical quality
To measure pedagogical quality, we used the KIDS assessment (Ringsmose & Kragh-Müller, 2014), which has been developed for the Nordic cultural context together with Danish preschool staff. The assessment is based on observations at the preschool, scored in nine dimensions: physical environment, relationships, play and activities, attention, socio-emotional development, participation and influence, experience and critical thinking, self-development, and language and communication. As the intervention may have affected all these dimensions, we used the total score in the analysis. The KIDS assessment measures pedagogic quality in relation to how it affects children’s chances of living a good life as a child. The assessment regards early childhood as an important period of life in itself, and not merely as preparation for school and adult life. The assessment also measures pedagogical quality in relation to children’s opportunities to develop the skills and competencies required to succeed in modern society. The KIDS score pertains to the preschool unit. As there were only sixteen units, our statistical power was limited and the analysis was exploratory.
2.2.3 Testing procedures
Preschool staff who knew the children well conducted both the language and the SDQ tests. Therefore, the preschool testers were aware of treatment status, because they knew if their unit was assigned to the treatment or the control group. Similarly, the municipal employee who conducted the KIDS assessment of pedagogical quality was also aware of treatment status.
Staff conducted the SDQ pre-tests between February 10 and March 17, 2017 and the post-test SDQ between January 21 and February 22, 2019. The timing of the pre-test language assessments covered a longer period than that of the SDQ pre-tests, as the language assessments are conducted individually with each child and take considerably more time to conduct than the SDQ tests. Therefore, we used any tests conducted before the intervention started. The pre-test period ranged from April 14, 2015 to February 11, 2017, for the analysis sample. The post-test period for the language tests ranged from January 1 to March 30, 2019. The pre- and post-test measurements of pedagogical quality were conducted during fall 2016, and from September to November, 2018, respectively.
2.2.4 Assignment to treatment and control groups
Although randomization ensures the assignment is statistically independent of student characteristics, even proper randomization procedures can produce imbalances between treatment and control groups in finite samples (Roberts & Torgerson, 1999). As we randomized a small number of preschool units, we used stratification to improve our chances of obtaining a balanced sample (Athey & Imbens, 2017).
The randomization procedure had two steps. In step one, we stratified preschool units by the total number of children and by pre-treatment scores. We first created two strata containing units with the number of children enrolled below and above the median (“small” and “large” units). Within these two strata, we created two more strata containing units with above- and below-median pre-treatment scores on the total SDQ for all children tested at pre-test (“high-” and “low-scoring” units).
We aimed to balance the treatment and control groups in terms of size to balance implementation conditions across the groups. If, for example, implementation is more difficult in larger units, this may be important for the estimates of effects. The second stratification aimed to balance treatment groups across the outcome measures. As the SDQ and the LAC were highly correlated on the unit level at pre-test, we chose to stratify using only one of them.
In step two, we randomized two units within each stratum in the treatment group and two units in the control group using the random number generator in Stata (StataCorp, 2017).
2.2.5 Treatment and control group balance
Table 1 shows that the treatment and control groups were well-balanced on our main outcome measures and child characteristics. However, despite stratifying on size, the units in the treatment group were smaller on average (compare the n in Table 1). There was also a relatively large difference on the KIDS score at pre-test, where the treatment group had a lower average score.
Attrition in the group that was old enough to take the pre-treatment tests (two years or older) and young enough to still be in preschool at the post-test (born 2013 or later) is relatively low on the SDQ-based measures and slightly higher on the language tests (there is no attrition regarding the KIDS score). The explanation for the difference between measures may be that although no preschool unit left the study during the intervention, one treatment unit lacked post-test language assessment scores. Attrition in the treatment group (control group) was 11% (15%) on the total SDQ score, 10% (17%) on the impact measure, 9% (15%) on the prosocial scale, 21% (28%) on the language composite, and 25% (30%) on the preliteracy composite. The attrition was therefore consistently higher in the control group. We show in the Online Appendix that the pre-treatment means among the group that left the study were also higher in the control group for all outcome measures (indicating more social-emotional problems and better language skills), although no difference was statistically significant (p > 0.1).
2.2.6 Control group condition
Preschool teachers in the control group units did not receive any particular intervention.
2.2.7 Statistical methods
We estimated the effects of the intervention on child outcomes using the following linear regression:
yi,post = α + β Treatmenti + λyi,pre + μi + εi(1)
where yi,post is one of our outcome variables measured at post-test, α is a constant, Treatmenti is an indicator for whether student i attended a preschool unit randomized to the treatment group or not, yi,pre is the pre-test score on the outcome measure, β and λ are parameters to be estimated, μi is a vector of dummy variables for the randomization strata, i.e., strata fixed effects, and εi is a random error term. We used a linear probability model for the binary impact measure (see e.g., Freedman, 2008, for arguments against using logit and probit when analyzing randomized experiments).
Because we have few preschool units (“clusters”), both multilevel models and standard methods for estimating cluster-robust standard errors are likely to underestimate standard errors (Cameron & Miller, 2015). We therefore reported the bounds on the 95% confidence set obtained from a wild-cluster bootstrap procedure implemented by the Stata command boottest (Roodman, MacKinnon, Nielsen & Webb, 2019), which often has better properties when there are few clusters. We clustered standard errors on the preschool unit the children attended at the time of the pre-test.
We used similar methods to analyze the pedagogical quality. However, the KIDS score pertains to the preschool unit, not the child, which meant that cluster-adjustment was not necessary.
2.3 Qualitative analysis
We gathered the material for the qualitative analysis through focus group interviews, as well as from the third and fourth authors’ participation in the workshops. The third author conducted the five focus group interviews in groups of four to five participants using a semi-structured technique (Kruuse, 2005), where the starting points were the collaboration with researchers, and the opportunities and obstacles to improve the quality of the adult-child interaction, in particular for disadvantaged children. We exemplify the themes that emerged during the interviews with characteristic examples and quotes.
3 Results
3.1 Results of the quantitative analysis
3.1.1 Main results
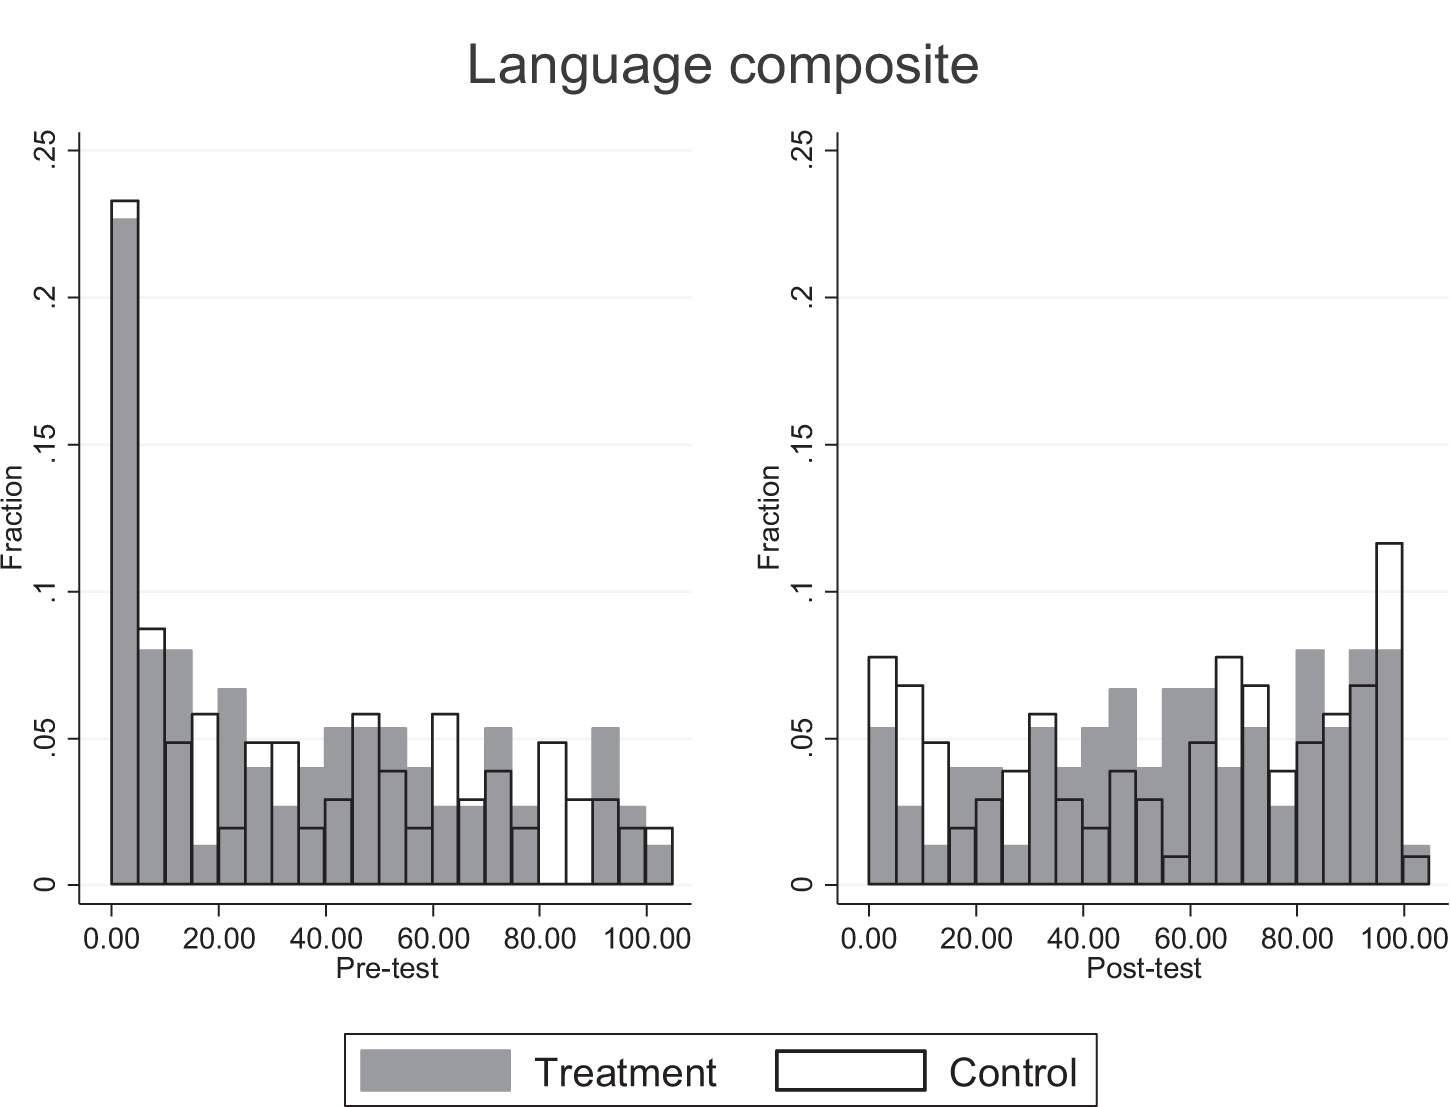
Figures A1-A4 in the Online Appendix display the pre-test and post-test distributions of the outcome variables. The distributions are reasonably similar across treatment and control groups at both pre- and post-tests, but the prosocial scale has a substantial risk of ceiling effects. Finding effects on the prosocial scale is therefore more unlikely.
Table 2 shows our main results. The table displays coefficients on the treatment indicator and the pre-test scores with 95% confidence intervals derived from the wild-cluster bootstrap in brackets. A positive coefficient implies a harmful effect in columns (1) and (2), where the total SDQ score and the impact-question are the outcome measures, and a beneficial effect in columns (3)–(5), where the prosocial scale and the language and preliteracy composites are the outcome measures.
The treatment effects indicate harmful effects on the SDQ-based outcome measures in columns (1)–(3), and beneficial effects on the language and preliteracy measures in columns (4) and (5). However, none of the treatment effects is statistically significant (p > 0.1), and most effects seem small. The impact measure is a partial exception and closest to reaching conventional levels of significance (p = 0.13).5 The effect in column (2) is twelve percentage points, which we can compare to the mean of around 40 percent at both pre- and post-test. The pre-test scores are, on the contrary, highly significant in all cases, meaning that scores, as expected, show a great deal of persistency over time.
| (1) | (2) | (3) | (4) | (5) | |
|---|---|---|---|---|---|
| VARIABLES | SDQ TOTAL | SDQ IMPACT | SDQ PROSOCIAL | LANGUAGE | PRELITERACY |
| Treatment | 0.88 | 0.12 | -0.28 | 2.03 | 2.37 |
| [-0.71, 2.52] | [-0.03, 0.27] | [-1.38, 0.64] | [-18.9, 15.8] | [-10.7, 12.3] | |
| Pre-treatment scores | |||||
| SDQ Total | 0.53*** | ||||
| [0.38, 0.70] | |||||
| SDQ Impact | 0.50*** | ||||
| [0.39, 0.60] | |||||
| SDQ Prosocial | 0.27*** | ||||
| [0.14, 0.41] | |||||
| Language total | 0.56*** | 0.36*** | |||
| [0.38, 0.76] | [0.16, 0.50] | ||||
| Observations | 296 | 293 | 299 | 178 | 171 |
| R2 | 0.30 | 0.30 | 0.14 | 0.35 | 0.17 |
Note: Source: Own measurements and calculations. All specifications include strata fixed effects, which are excluded from the table for brevity. Bounds on the 95% confidence set from wild-cluster bootstrap in brackets. ***p < 0.01, **p < 0.05, *p < 0.1.
3.1.2 Sensitivity analyses
In the Online Appendix, we show that our results are similar if we instead use the full sample at post-test. Including the number of children per preschool or the KIDS pre-test score as additional covariates, or removing all covariates except the strata indicators, changed the estimates of the treatment effects slightly, but all estimates are still insignificant.
3.1.3 Exploratory analyses
We report the full results of the exploratory analyses in the Online Appendix and comment briefly on the most important results here. Both groups increased their KIDS scores from pre- to post-test, but the treatment group’s score increased more than that of the control group. However, the treatment effect is not statistically significant. Furthermore, we found no statistically significant estimates of heterogeneous treatment effects across pre-treatment KIDS scores and outcome measures, although some estimates are large. In particular, preschools with low initial KIDS scores show less harmful effects on the total SDQ score and more beneficial scores on the preliteracy composite.
Although not statistically significant, the SDQ estimates raise the question of whether the intervention changed practices for the worse. In the Online Appendix, we report results from estimations where we used two samples that were exposed to the intervention over a shorter period: children who left their preschool units in April 2018 because they were starting primary school (“school starters”), and children who were not assessed at pre-test and were relatively young at the time of the post-test. The latter group likely transferred from a nursery recently before the post-test. If the changed practices were harmful, then we would expect smaller harmful effects for the groups that were exposed to the intervention for a shorter period.
The results indicate that this is not the case. The harmful treatment effects are either slightly or quite a lot larger in the groups that received a smaller dose of the intervention. Although we cannot rule out that changed practices contributed to the harmful estimates, these results are consistent with the hypothesis that the intervention changed the staff’s reporting rather than had a harmful impact on the children. We discuss this issue further in the final section.
3.2 Qualitative results
This section reports the results from the focus group interviews. We have grouped the results around three themes: focus on children from disadvantaged backgrounds, changed practices, and resource constraints.
3.2.1 Focus on children from disadvantaged backgrounds
The focus group interviews indicated that the intervention succeeded in making practitioners focus on children from disadvantaged backgrounds and creating an understanding that these children may need special measures and attention over relatively long periods.
“It has helped to make it a high priority. What we do for disadvantaged children. It is an ongoing process. It’s not something you forget. The elongated period has helped us to get our roots down.”
This finding indicated that, before the intervention, practitioners may not have been fully aware of their influence on the development of children from disadvantaged backgrounds. In turn, practitioners may not have been sufficiently involved in improving this development. Furthermore, the participants expressed that the program’s focus on children from disadvantaged backgrounds prompted participants to talk with non-participating colleagues within their preschool units about which children needed more support, and what types of support that would work. In line with the intention of the intervention, there is thus some evidence of intervention practices spreading to preschool teachers and assistants outside the group of participants. Moreover, the participants were very positive about the increased discussion about and focus on the children from the most disadvantaged backgrounds.
“The concept of focus children has helped us going back to the core of what we do. We really do want to take care of these children’s needs. […] To focus on the individual. It harmonizes the whole environment when you do something for the disadvantaged.”
3.2.2 Changed practices
According to the participants, the intervention resulted in more focus on play, and led participants to view play as important and time used for play as meaningful. Adult-child interaction through play, sometimes scripted, was highlighted as something positive by the participants, partly because they thought it worked well with the children and partly because it gave the participants the opportunity to immerse themselves in the interaction with the children. The participants mentioned the importance of having concrete examples and challenges from their own day-to-day practice, and that the workshop format allowed them to discuss these examples with a larger network of preschool teachers, assistants, and researchers. Discussing such issues with colleagues within the preschool unit was also seen as an important basis for pedagogical development.
“When the play starts, we stay involved. If we give ourselves permission to stay involved.”
“We have also used play manuscripts with one focus child. And it works. It works best when the whole staff is involved.”
“It was good that there was both theory and participation in groups with staff from other units. […] That has been inspiring. One has to reflect and explain oneself more.”
Many participants mentioned the focus on the changeable aspects of the learning environment as an important lesson from the intervention. Some participants reported that they had started experimenting more with the pedagogical environment, and with the form and content of the adult-child interaction. Participants also expressed that their views on children had changed and that children were given more influence.
“That [focus on changeable aspects] about the pedagogical environment has been most important to us in terms of strengthening the children.”
“We have made a survey and the children […] say that they have more influence.”
“Influence is also contained in the play. In the interplay. The child gains decision making experience.”
The collaboration with the researchers has also resulted in some participants feeling more secure in their roles, both in the workplace and in relation to other professionals and institutions, such as child psychologists and schools.
“When I get to work, I know precisely what to do. I know my role.”
“Earlier we heard what we should teach [the children] this and that. […] Now we speak of our strengths and what [the schools] should teach. We have strengthened our pedagogical arguments.”
“We have collaborated more with child psychologists around the child.”
3.2.3 Resource constraints
For some participants and units, the intervention may have increased the demand on scarce resources. Some participants said the process of choosing focus children also raised questions of other children, whom in the end did not become focus children, but whom also needed more support.
“We had six children. That was too many. […] Our unit was in some turmoil. It would have been better to have one or two children in focus.”
“It may be that we have focus children. But it also opens one’s eyes to other children. Then one starts thinking. Should he also be a focus child?”
That is, choosing and discussing focus children sometimes highlighted that there are many children who need extra support, and that this led to resources being spread too thinly across children. Some participants expressed feelings of being overwhelmed. In turn, such feelings may lead to staff seeing the children as having problems rather than focusing on improving the environment to help all children develop.
In relation to resource demands, several participants mentioned the importance of having support from their colleagues and management. If everyone works towards the same goal, then the participants thought that it is possible to improve the development of the children from the most disadvantaged backgrounds:
“It is a joint task. You have to have everyone on board.”
As mentioned earlier, a few participants mentioned intervention practices spreading to colleagues who did not participate in the intervention, but this was not the case in all units. Many interviewees acknowledged that it was difficult to affect long-standing and routine practices:
“We are also up against many decades of practice.”
Some participants reported that the potential for changing adult-child interactions was connected to the larger organizational environment. For instance, during the project period, one unit got a new manager who was supportive of the project and the new practices. This led to a large overhaul of organizational routines.
“In our case, the [collaboration] turned everything upside down. We work in a different way. We are not separated in subunits. […] It gives more freedom and less conflicts. […] It has become easier to be a preschool teacher. It has become a completely different preschool. We were ready for this.”
In this unit, the larger disruption of organizational practice aided implementation of the new practices learned through the intervention. Other units made much more limited changes and had trouble spreading new practices to non-participating preschool teachers and assistants in their unit.
4 Discussion
Our quantitative analysis of a participatory professional development program for preschool teachers and assistants showed no significant effects on measures of children’s social-emotional, language, and preliteracy skills. Our qualitative analysis found indications of changed views and practices among participants, but also circumstances that may have reduced the impact of the intervention. In this section, we use the results from the qualitative and exploratory analysis to discuss the, in our view, most plausible reasons for why the child outcomes did not improve. We then discuss the limitations of our study design and conclude with suggestions for future interventions and studies.
4.1 Reasons for the lack of improvement on child outcomes
The qualitative analysis highlighted some organizational constraints. While the intervention was highly participatory at the individual teacher level, it did not include all staff, and in most cases did not include the managers. As suggested by Andersen and Jakobsen (2012), support from management is vital for PD to be successful. Affecting unit-wide practices requires organizational support, something that the intervention did not provide. As preschool units did not volunteer to participate in the intervention, organizational support may not have been sufficient everywhere and the necessary resources may not have been present. Resource constraints limited work with other children than the focus children, as reflected by staff expressing feelings of being overwhelmed in the focus group interviews. A broad focus on the relational conditions (ratio, group size, educational level, support from management) of the ECEC is vital. In this project emphasis was on the interactions between practitioners and children, which might be too narrow. The focus group interviews furthermore indicated that it was sometimes difficult to affect long-standing and routine practices. In some units, the intervention may therefore have involved only a limited number of children and staff, in which case it is not surprising that we saw few improvements.
The KIDS scores indicate that the preschool units in the treatment group improved their pedagogical quality more than the control group. However, the effect was not statistically significant. Furthermore, the effect of higher process quality on child outcomes is typically small. Studies with (as good as) random assignment of children to preschool or kindergarten classes report that while higher classroom quality leads to beneficial effects on child outcomes, the effects on child outcomes are five to ten times smaller than the effects on the classroom quality measures (Araujo, Carneiro, Cruz-Aguayo & Schady, 2016; Auger et al., 2014). Such a ratio would suggest that our intervention had limited impact on child outcomes, even if the effect on pedagogical quality were real.
A limited impact of the intervention should imply small or null effects, not harmful effects. We found indications of harmful effects on the measures of social-emotional skills. Although it is important to recall that these estimates were not statistically significant, there is a risk that they are real and that our study was underpowered to find effects of this magnitude. We examined whether the intervention dosage was associated with larger harmful effects, but found no such evidence. Had the intervention changed preschool practices for the worse, the more exposed children ought to have been more affected.
As this was not what we found, the intervention may instead have changed how the staff reported on the SDQ. For example, the focus group interviews revealed that the intervention had, to some extent at least, succeeded in its aim of involving the adults more in children’s play and allowed children a greater degree of codetermination and independence in the adult-child interactions. More interaction and a more active role for children may also imply that teachers and assistants became more aware of behavioral, social, and emotional problems, and reported them on the SDQ. As the language and preliteracy pre- and post-tests involved the children directly, these tests seem less likely to be affected in the same way.
The question of whether the tests reflect changed reporting or practices relates to the more general issue of how test assessors may have been affected by their knowledge of treatment status. It is difficult and resource intensive to use assessors who are blind to treatment status. Most studies of PD programs that have used similar measures to ours have also used non-blind assessors (Bleses et al., 2018; Jensen et al., 2013, 2017; Reinke, Herman & Dong, 2018; Seabra-Santos et al., 2018; Snyder, McLean, Sandall, McLaughlin & Algina, 2018; Yoshikawa et al., 2015). The potential bias from lack of blinding is difficult to identify, as it may depend on both the respondents’ emotional responses (Kennedy, 2016), the test, and the procedures used.
4.2 Limitations of the study design
The number of units randomized to the treatment and control group limited our statistical power. We would have needed a large increase in the number of units to obtain adequate power in relation to the effect sizes indicated by most of our estimates, which were smaller than expected.
As mentioned earlier, using non-blinded assessors is a limitation. Preschool teachers are otherwise considered as reliable raters of children’s skills (Reinke et al., 2016) and it is difficult to find assessors who know the children and their social environment well enough, and are not influenced by the study. For example, although parents may be less directly involved in an intervention and could be used as assessors, they should be (and were in our case) informed about their children’s participation.
We measured the outcomes a relatively short time after the intervention. Studies following the long-term effects of preschool PD on the participating children, or on new cohorts of children that receive care from participating teachers and assistants are rare in the PD literature in schools and preschools, but there are some indications of more beneficial effects on later cohorts (Kennedy, 2016; Zaslow et al., 2010). This evidence suggests that it may take some time before new practices can be implemented effectively.
4.3 Concluding remarks
We found no improvements of children’s social-emotional, language, and preliteracy skills following a participatory professional development intervention for preschool teachers and assistants. Despite the lack of improvements found, we believe our mixed-methods study suggests some interesting avenues for future studies of PD programs.
Our results indicate that organizational support for new practices is an important factor and that a lack of resources may have limited the impact of the interventions. A set-up in which researchers come to the preschools and suggest improvements based on direct observations of day-to-day practice may have several advantages: observations are “live”, a larger share of staff can be involved, and costs for travelling and hiring substitutes are reduced for the preschools. Interventions could aim to improve support functions for teachers and assistants, and the effect of including managers as participants alongside teachers and assistants would be interesting to study.
A related suggestion is to target preschools that possess sufficient organizational support before the intervention. Assessing if the support is sufficient may however be difficult, but randomizing between preschools that volunteer to participate ought to increase the level of organizational support compared with mandatory participation, while still keeping internal validity high. However, managers, teachers, and assistants who are not motivated to change may be those who are most in need of PD. Interventions that include a motivational component would therefore be interesting to study.
The limitations of our own study prompt us to suggest that new studies of the effect of PD interventions in ECEC should be large scale and use assessors who are blind to treatment status. Furthermore, future studies should include long-term follow-up on both participating children and staff, as well as follow-up on new cohorts of children.
References
- Andersen, S. C. & Jakobsen, M. (2012). Hovedresultater fra en eksperimentel undersøgelse af en forstærket indsats over for førskolebørn med dansk som andetsprog. Report, Institut for Statskundskab, Aarhus Universitet.
- Aras, S. (2016). Free play in early childhood education: A phenomenological study. Early Child Development and Care, 186(7), 1173–1184.
- Araujo, M. C., Carneiro, P., Cruz-Aguayo, Y. & Schady, N. (2016). Teacher quality and learning outcomes in kindergarten. Quarterly Journal of Economics, 131(3), 1415–1453.
- Athey, S. & Imbens, G. (2017). The econometrics of randomized experiments. In A. Banerjee & E. Duflo (Eds.), Handbook of field experiments, volume 1. Elsevier.
- Auger, A., Farkas, G., Burchinal, M. R., Duncan, G. J. & Vandell, D. L. (2014). Preschool center care quality effects on academic achievement: An instrumental variables analysis. Developmental Psychology, 50(12), 2559–2571.
- Black, M. M., Walker, S. P., Fernald, L. C., Andersen, C. T., DiGirolamo, A. M., Lu, C., … & Devercelli, A. E. (2017). Early childhood development coming of age: Science through the life course. Lancet, 389(10064), 77–90.
- Bleses, D., Højen, A., Justice, L. M., Dale, P. S., Dybdal, L., Piasta, S. B., … & Haghish, E. F. (2018). The effectiveness of a large-scale language and preliteracy intervention: The SPELL randomized controlled trial in Denmark. Child Development, 89(4), e342-e363.
- Bleses, D., Vach, W., Jørgensen, R. N. & Worm, T. (2010). The internal validity and acceptability of the Danish SI-3: A language screening instrument for 3-year-olds. Journal of Speech, Language, and Hearing Research, 53, 490–507.
- Bronfenbrenner, U. & Morris, P. A. (2006). The bioecological model of human development. In W. Damon (Series Ed.) & R. M. Lerner (Vol. Ed.), Handbook of child psychology: Theoretical models of human development (pp. 793–828). Wiley.
- Broström, S., Jensen, A. S., Hansen, O. H. & Svinth, L. (2016). Barnet i centrum – pædagogik og læring i vuggestue og dagpleje. Akademisk Forlag.
- Buysse, V. & Hollingsworth, H. L. (2009). Program quality and early childhood inclusion: Recommendations for professional development. Topics in Early Childhood Special Education, 29(2), 119–128.
- Børne- og Socialministeriet (2018). Information vedrørende sprogvurderingsmaterialet ‘Sprogvurdering 3-6’. Sagsnummer 2017-5545. https://socialministeriet.dk/media/19260/information_vedroerende_sprogvurdering_3-6_t.pdf
- Cameron, A. C. & Miller, D. L. (2015). A practitioner’s guide to cluster-robust inference. Journal of Human Resources, 50(2), 317–372.
- Christoffersen, M., Højen-Sørensen, A. K. & Laugesen, L. (2014). Daginstitutionens betydning for børns udvikling: en forskningsoversigt. SFI-Det Nationale Forskningscenter for Velfærd.
- Conner, D. R. (2003). Managing the speed of change – how resilient managers succeed and prosper where others fail. Villard Books.
- Darling-Hammond, L., Hyler, M. E. & Gardner, M. (2017). Effective teacher professional development. Learning Policy Institute.
- Dietrichson, J., Kristiansen, I. L. & Viinholt, B. A. (2020). Universal preschool programs and long-term child outcomes. Journal of Economic Surveys, 34(5), 1007–1043. https://doi.org/10.1111/joes.12382
- Egert, F., Fukkink, R. G. & Eckhardt, A. G. (2018). Impact of in-service professional development programs for early childhood teachers on quality ratings and child outcomes: A meta-analysis. Review of Educational Research, 88(3), 401–433.
- Filges, T., Torgerson, C., Gascoine, L., Dietrichson, J., Nielsen, C. & Viinholt, B. A. (2019). Effectiveness of continuing professional development training of welfare professionals on outcomes for children and young people: A systematic review. Campbell Systematic Reviews, 15(4), e1060.
- Freedman, D. A. (2008). Randomization does not justify logistic regression. Statistical Science, 23(2), 237–249.
- Fukkink, R., Helmerhorst, K., Deynoot-Schaub, M. G. & Sluiter, R. (2019). Training interaction skills of pre-service ECEC teachers: Moving from in-service to pre-service professional development. Early Childhood Education Journal, 47, 497–507.
- Hedges, H. & Cooper, M. (2018). Relational play-based pedagogy: Theorising a core practice in early childhood education. Teachers and Teaching: Theory and Practice, 24(4), 369–383.
- Huntsman, L. (2008). Determinants of quality in child care: A review of the research evidence. New South Wales Department of Community Services.
- Jensen, B., Holm, A., Allerup, P. & Kragh, A. (2009). Effekter af indsatser for social udsatte børn i daginstitutioner – HPA projektet. Danmarks Pædagogiske Universitetsforlag.
- Jensen, B., Holm, A. & Bremberg (2013). Effectiveness of a Danish early year preschool program: A randomized trial. International Journal of Educational Research, 62, 115–128.
- Jensen, B., Jensen, P. & Rasmussen, A. W. (2013). Vidensbaseret indsats over for udsatte børn i dagtilbud – modelprogram. VIDA-forskningsrapport 1. Effekter af VIDA I: VIDA-forskningsserien 2013:5. Aarhus Universitet, IUP.
- Jensen, B., Jensen, P. & Rasmussen, A. W. (2017). Does professional development of preschool teachers improve children’s socio-emotional outcomes? Labour Economics, 45, 26–39.
- Kennedy, M. M. (2016). How does professional development improve teaching? Review of Educational Research, 86(4), 945–980.
- Kline, P. & Walters, C. R. (2016). Evaluating public programs with close substitutes: The case of Head Start. Quarterly Journal of Economics, 131(4), 1795–1848.
- Kraft, M. A., Blazar, D. & Hogan, D. (2018). The effect of teacher coaching on instruction and achievement: A meta-analysis of the causal evidence. Review of Educational Research, 88(4), 547–588.
- Kruuse, E. (2005). Kvalitative forskningsmetoder i psykologi og beslægtede fag. Copenhagen: Dansk Psykologisk Forlag.
- Markussen-Brown, J., Juhl, C. B., Piasta, S, B., Bleses, D., Højen, A. & Justice, L. M. (2017). The effects of language- and literacy-focused professional development on early educators and children: A best-evidence meta-analysis. Early Childhood Research Quarterly, 38(1), 97–115.
- Kragler, S., Martin, L. & Kroeger, D. (2008). Money down the drain: Mandated professional development. Journal of School Leadership, 18, 528–550.
- McCoy, D. C., Yoshikawa, H., Ziol-Guest, K. M., Duncan, G. J., Schindler, H. S., Magnuson, K., … & Shonkoff, J. P. (2017). Impacts of early childhood education on medium- and long-term educational outcomes. Educational Researcher, 46(8), 474–487.
- Ministry for Social Affairs. (2016). Børns tidlige udvikling of læring. Målgrupperapport. https://dk.ramboll.com/medier/rdk/~/media/DCB01463CD8343808D7E327008062344.ashx
- Nielsen, T. K., Tiftikci, N. & Søgaard Larsen, M. (2013). Virkningsfulde tiltag i dagtilbud. Et systematisk review af reviews. Clearinghouse-forskningsserien 2013, nummer 16, København: DPU, Aarhus Universitet.
- OECD. (2018a). Education at a glance 2018: OECD indicators. OECD Publishing.
- OECD. (2018b). Engaging young children: Lessons from research about quality in early childhood education and care. OECD Publishing.
- Pianta, R. C., Barnett, W. S., Burchinal, M. & Thornburg, K. R. (2009). The effects of preschool education: What we know, how public policy is or is not aligned with the evidence base, and what we need to know. Psychological Science in the Public Interest, 10(2), 49–88.
- Reinke, W. M., Herman, K. C. & Dong, N. (2018). The incredible years teacher classroom management program: Outcomes from a group randomized trial. Prevention Science, 19(8), 1043–1054.
- Ringsmose, C. & Kragh-Müller, G. (2014). KIDS – Kvalitet i Daginstitutioner. Dansk Psykologisk Forlag.
- Ringsmose, C. & Svinth, L. (2019). Virkningsfuldt pædagogisk arbejde i dagtilbud. DPU, Aarhus Universitet.
- Roodman, D., Nielsen, M. Ø., MacKinnon, J. G. & Webb, M. D. (2019). Fast and wild: Bootstrap inference in Stata using boottest. Stata Journal, 19(1), 4–60.
- Roberts, C. & Torgerson, D. J. (1999). Understanding controlled trials: Baseline imbalance in randomised controlled trials. BMJ, 319(7203), 185–185.
- Sabol, T. J., Hong, S. S., Pianta, R. C. & Burchinal, M. R. (2013). Can rating pre-k programs predict children’s learning? Science, 341(6148), 845–846.
- Seabra-Santos, M. J., Gaspar, M. F., Major, S. O., Patras, J., Azevedo, A. F., Homem, T. C., … & Vale, V. (2018). Promoting mental health in disadvantaged preschoolers: A cluster randomized controlled trial of teacher training effects. Journal of Child and Family Studies, 27(12), 3909–3921.
- Snyder, P., Hemmeter, M. L., McLean, M., Sandall, S., McLaughlin, T. & Algina, J. (2018). Effects of professional development on preschool teachers’ use of embedded instruction practices. Exceptional Children, 84(2), 213–232.
- Socialstyrelsen. (2017). Vejledning til Sprogvurdering 3-6. https://bedstsammen.kk.dk/sites/bedstsammen.kk.dk/files/vejledning_-_sprogvurdering_3-6_-_06122017.pdf
- StataCorp. 2017. Stata statistical software: Release 15. StataCorp LP.
- UNESCO. (2018). Gross enrolment ratio, pre-primary, both sexes (%). UNESCO Institute for Statistics. http://data.uis.unesco.org/index.aspx?queryid=142#
- van Huizen, T. & Plantenga, J. (2018). Do children benefit from universal early childhood education and care? A meta-analysis of evidence from natural experiments. Economics of Education Review, 66, 206–222.
- Vermeer, H. J., van IJzendoorn, M. H., Cárcamo, R. A. & Harrison, L. J. (2016). Quality of child care using the environment rating scales: A meta-analysis of international studies. International Journal of Early Childhood, 48(1), 33–60.
- Vygotsky, L. S. (2004). Pædagogisk psykologi. In G. Lindqvist (Ed.), Vygotsky – om læring som udviklingsvilkår. Forlaget Klim.
- Werner, C. D., Linting, M., Vermeer, H. J. & Van IJzendoorn, M. H. (2016). Do intervention programs in child care promote the quality of caregiver-child interactions? A meta-analysis of randomized controlled trials. Prevention Science, 17(2), 259–273.
- Yoshikawa, H., Leyva, D., Snow, C. E., Treviño, E., Barata, M., Weiland, C., … & Arbour, M. C. (2015). Experimental impacts of a teacher professional development program in Chile on preschool classroom quality and child outcomes. Developmental Psychology, 51(3), 309–322.
- Zaslow, M., Tout, K., Halle, T., Whittaker, J. & Lavelle, B. (2010). Towards the identification of features of effective early childhood professional development: A review of the literature. Prepared for the U.S. Department of Education, Office of Planning, Evaluation, and Policy Development, Policy and Program Studies Service, Washington, DC.
Appendix to “Participatory professional development and preschool quality: Evidence from a mixed-methods study”
A1 Attrition analysis
Table A1 shows results from an attrition analysis. Attrition in the treatment group (control group) was 11% (15%) on the total SDQ score, 10% (17%) on the impact measure, 9% (15%) on the prosocial scale, 21% (28%) on the language composite, and 25% (30%) on the preliteracy composite. The children with missing values have overall higher values on the SDQ-based measures (indicating more problems and fewer prosocial skills) and higher values on the language measures (indicating better language skills). Note that the group with missing values differs across the measures. The means among children with missing values at post-test is higher in the control group for all outcome variables, indicating more social-emotional problems (on the total SDQ score and the impact questions), fewer prosocial skills, and more language skills.
We tested whether the differences are statistically significant by running a regression with the outcome variables as dependent variables and the treatment indicator as the only explanatory variable. The p-values in column (7) are derived from a wild cluster bootstrap (as described in the section Statistical methods in the main text). No difference is significant (p > 0.1), although the differences on the SDQ-based measures are relatively large. However, the relatively low level of attrition on the SDQ-based measures ought to make it unlikely that attrition had a substantial impact on our estimates. The primary analysis sample, which only contains children without missing pre- and post-test observations, is also well-balanced on all child-level variables (see Table 1 in the main text).
| MEASURE | TREATMENT | CONTROL | |||||
|---|---|---|---|---|---|---|---|
| (1) | (2) | (3) | (4) | (5) | (6) | (7) | |
| Eligible, pre-test | Missing, post-test | Mean, missing | Eligible, pre-test | Missing, post-test | Mean, missing | p | |
| SDQ Total | 134 | 15 | 9.5 | 184 | 27 | 13.5 | 0.13 |
| Impact | 134 | 14 | 0.43 | 184 | 31 | 0.52 | 0.56 |
| Prosocial | 134 | 12 | 7.5 | 184 | 27 | 5.3 | 0.13 |
| Language composite | 100 | 21 | 43.8 | 141 | 39 | 45.4 | 0.89 |
| Preliteracy composite | 100 | 25 | 38.7 | 141 | 42 | 42.3 | 0.75 |
Note: The means in column (3) and (6) are for the eligible children with missing post-tests. The p-value reported in column (7) is from a test of whether the coefficient on the treatment indicator is significantly different from zero in a regression of the outcome measure in question on the treatment indicator.
A2 Distribution of pre- and post-test scores
Figures A1 to A4 display the pre- and post-test distributions of the four non-binary outcome measures. As we do not have access to separate composites for language and preliteracy from the older version of the Language Assessment for Children (LAC) used at pre-test, the pre-test distributions for the language and preliteracy composites are from the same variable.
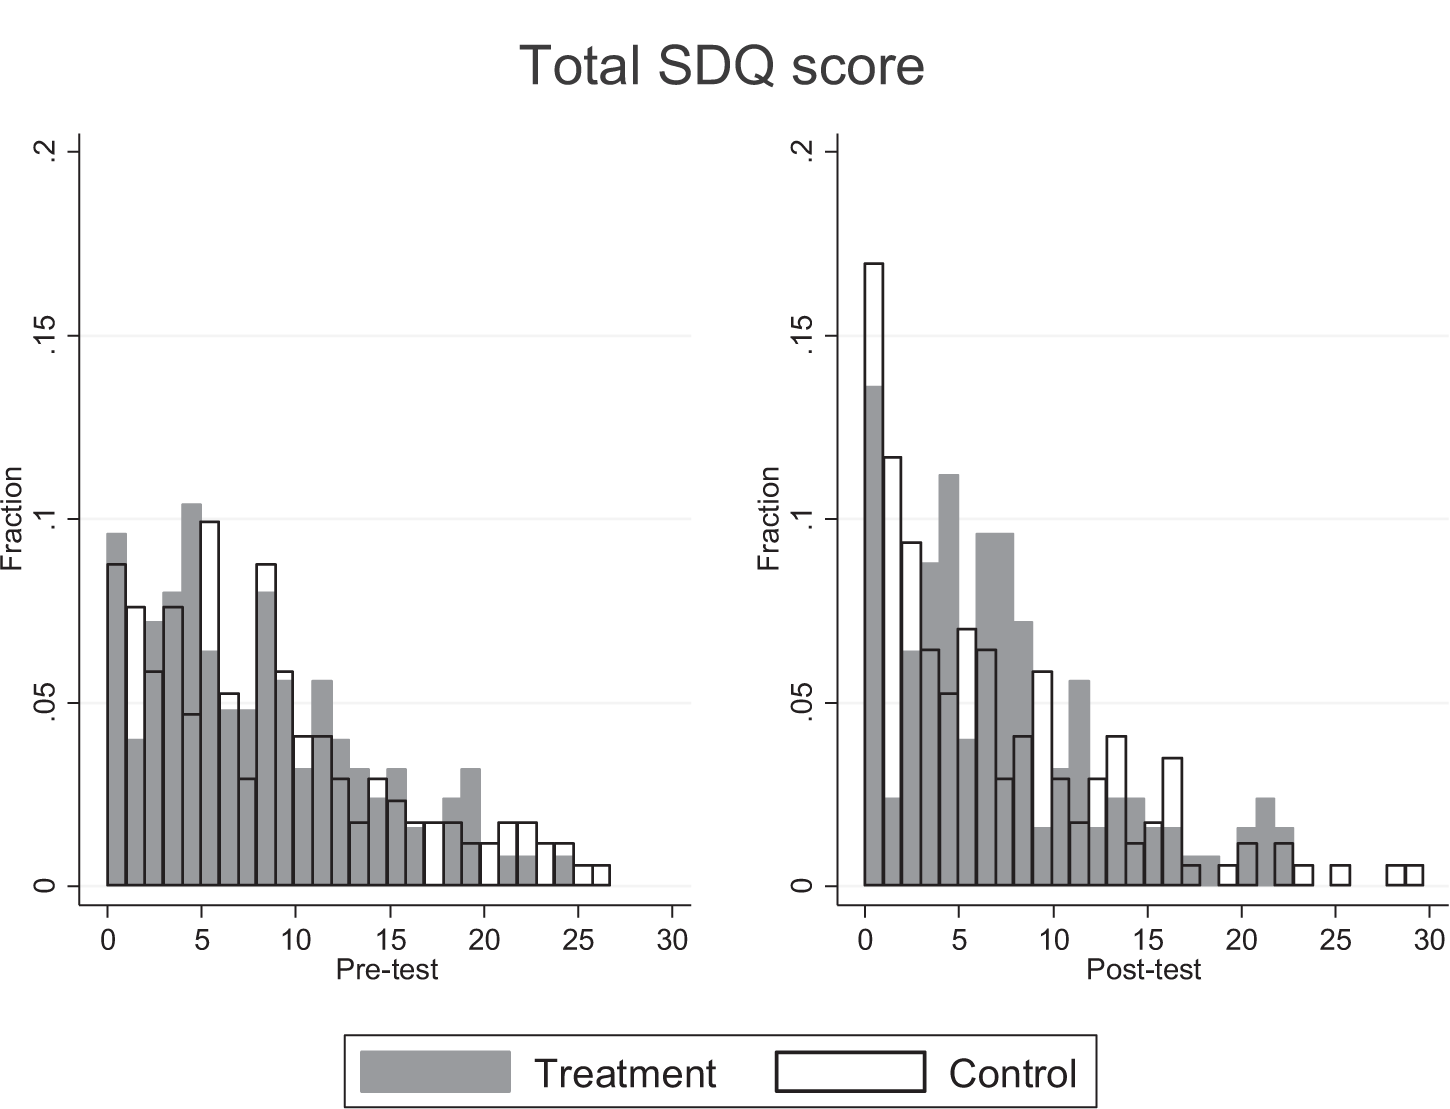
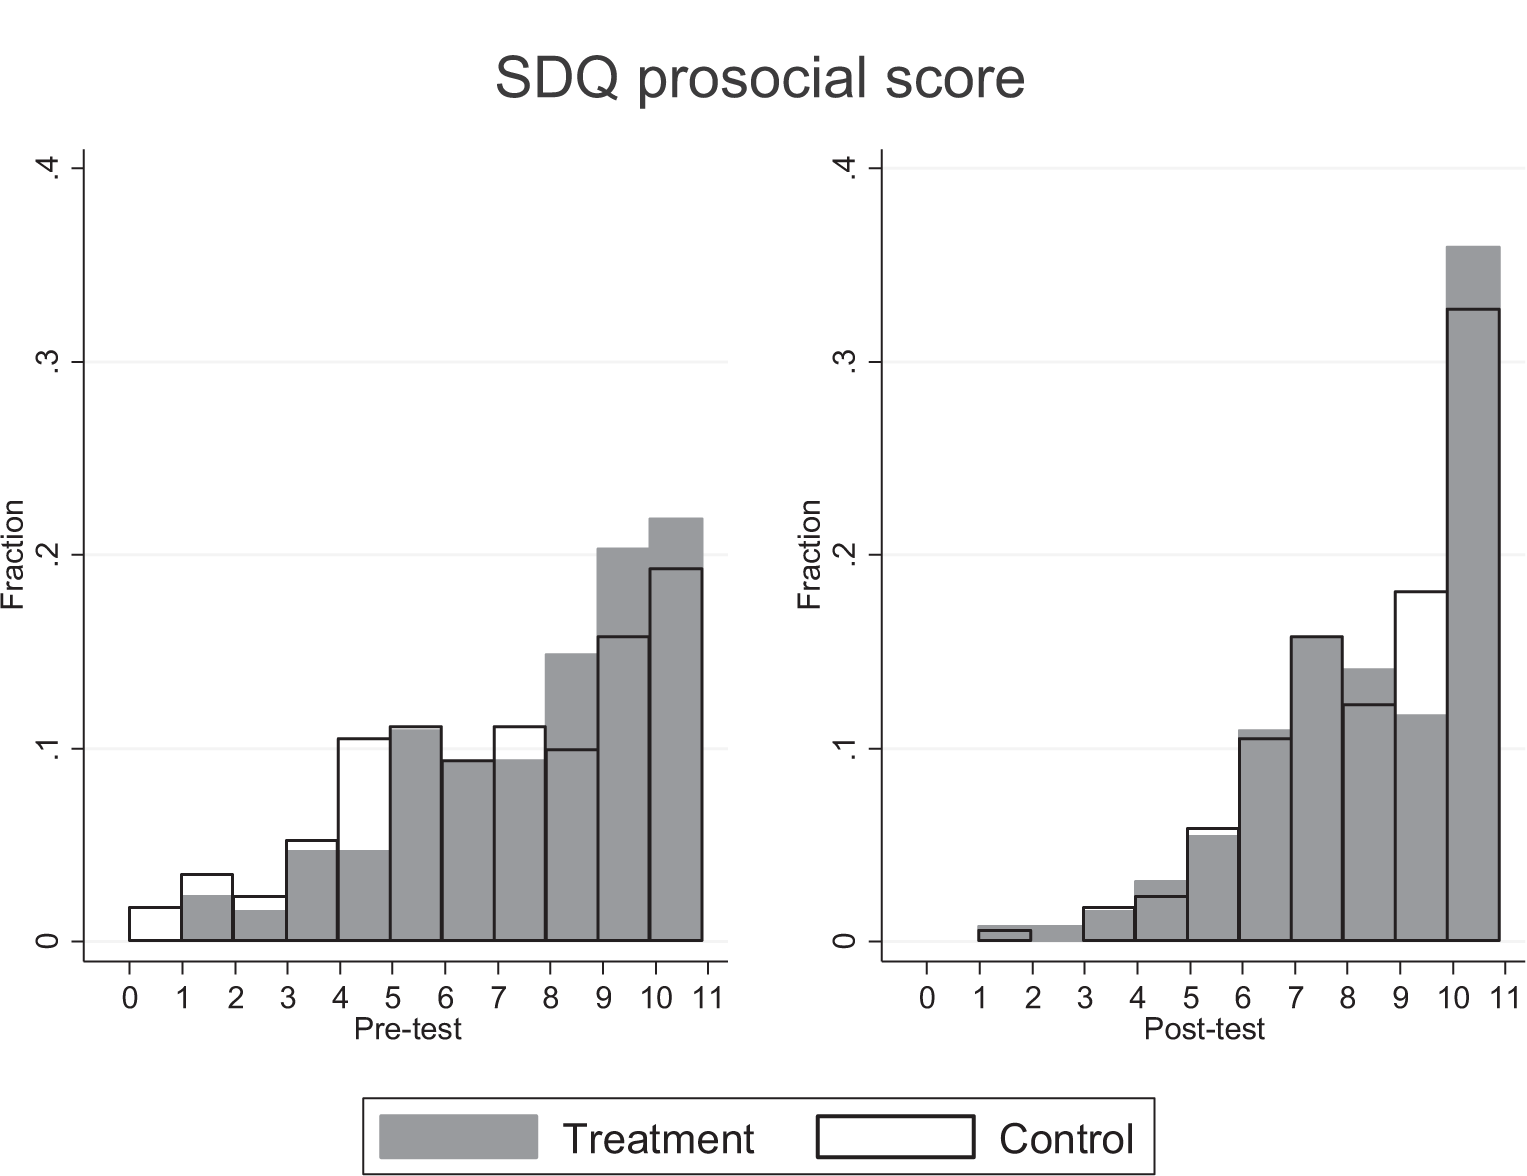
The two most important messages from these figures are that the distributions are reasonably similar across treatment and control groups at both pre and post-tests, and that the prosocial scale has a substantial risk of ceiling effects. Around 20 percent of the children in both groups have a maximum score of 10 at pre-test on the prosocial scale. At post-test, this share is 36 and 33 percent in the treatment and control groups. Finding effects on the prosocial scale is therefore more unlikely.
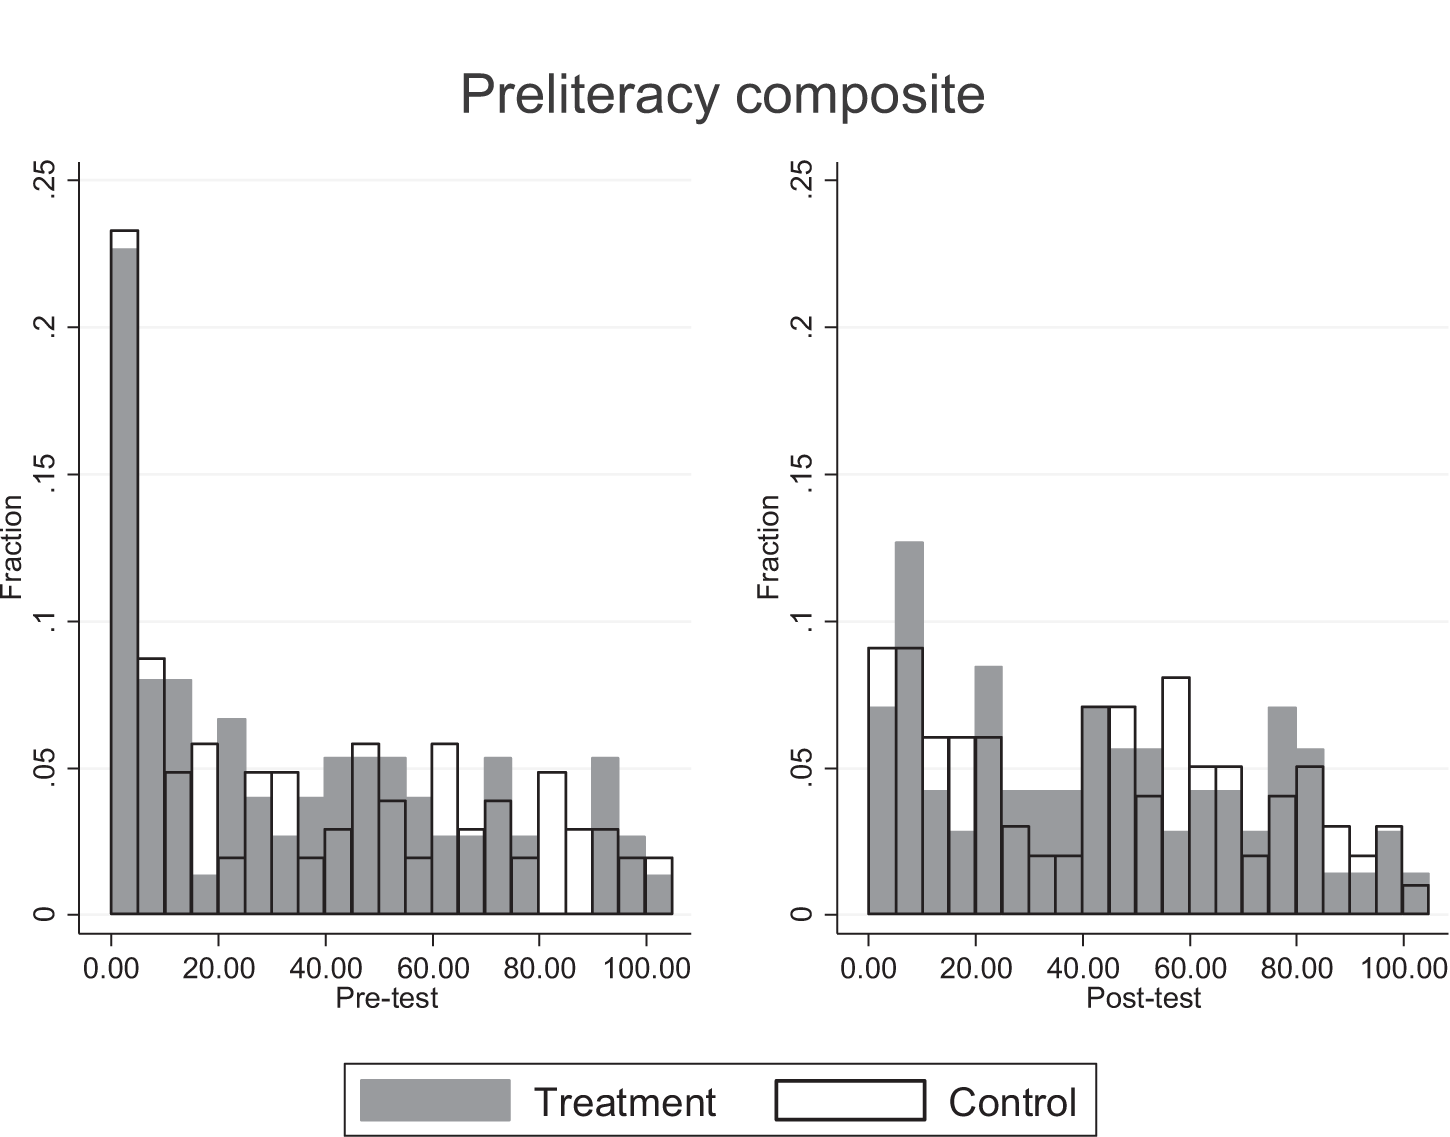
There is also some risk of floor effects on the total SDQ score, especially at post-test where a non-negligible share of children score 0. The LAC is reported as percentile scores so evaluating floor and ceiling effects on this test is difficult.
A3 Sensitivity analyses
Table A2 shows the results of the sensitivity analyses. For brevity, the table displays only the coefficient estimate and the bounds of the 95% confidence sets (in brackets) from four different versions of our main specification. Note that the confidence set need not be symmetric around the coefficient estimate (Roodman et al., 2018). The four sensitivity analyses were repeated for each outcome variable (shown in the leftmost column). Column (1) uses the full sample assessed at post-test and consequently, as many children assessed at post-test were not assessed at pre-test, omits the pre-test score from the covariates (the strata fixed effects are included in all specifications shown in Table A2). Column (2) excludes the pre-test scores from the covariates but uses the primary analysis sample. Column (3) adds the number of children in each preschool unit (preschool size) to the main specification. Column (4) adds the pre-treatment KIDS score to the main specification.1
| (1) | (2) | (3) | (4) | |
|---|---|---|---|---|
| OUTCOME VARIABLE | FULL SAMPLE | NO PRE-TESTS | PRESCHOOL SIZE | KIDS PRE-TEST |
| Total SDQ score | 0.750 | 0.669 | 0.393 | 0.781 |
| [-0.835, 2.63] | [-1.63, 2.78] | [-1.701, 2.741] | [-0.835, 2.55] | |
| Impact | 0.107 | 0.104 | 0.134 | 0.129 |
| [-0.0674, 0.281] | [-0.109, 0.319] | [-.07319, .3751] | [-0.136, 0.360] | |
| Prosocial | 0.0235 | -0.122 | -0.103 | -0.123 |
| [-0.700, 0.767] | [-1.46, 1.02] | [-1.43, 1.20] | [-1.36, .734] | |
| Language composite | 0.326 | 0.550 | 8.319 | 4.389 |
| [-26.8, 17.6] | [-28.4, 18.5] | [-8.83, 21.8] | [-15.3, 27.2] | |
| Preliteracy composite | 1.110 | 1.471 | -1.298 | 9.280 |
| [-18.2, 15.1] | [-17.9, 16.1] | [-17.1, 17.2] | [-10.0, 26.3] |
Note: The table displays the coefficients on the treatment indicator and the bounds of the 95% confidence sets (in brackets) from four different versions of our main specification (based on Equation 1). The four sensitivity analyses are repeated for each outcome variable (shown in the leftmost column). Column (1) uses the full sample assessed at pre-test and consequently omits the pre-test score of the outcome variables. Column (2) excludes the pre-test scores but uses the primary analysis sample (and retains the strata fixed effects). Column (3) adds the number of children in each preschool unit (preschool size) to the main specification. Column (4) adds the pre-treatment KIDS score to the main specification. All specifications include strata fixed effects. The number of observations in column (1) are: 832 (total SDQ score), 841 (impact), 827 (prosocial scale), 181 (language composite), and 174 (preliteracy composite). The number of observations in columns (2)-(4) follows the main specification presented in Table 2 of the main text.
There are some differences to our main specification: the treatment estimate changes sign in the regression on the prosocial scale for the full sample (column 1); the estimate is smaller for the total SDQ score and the preliteracy composite, and larger for the language composite when preschool size is added to the covariates (column 3); and the treatment estimate is larger for both the language and the preliteracy compositive when the pre-treatment KIDS score is added to the covariates (column 4). However, the main message is that no treatment estimate is statistically significant, and that the sensitivity analyses do not alter any of our conclusions.
A4 Exploratory analyses
The treatment group increase their KIDS score a lot more than the control group from the pre-treatment assessment. The difference in the gain score amount to nearly half a post-test standard deviation. However, as the treatment group had a lower mean score before the intervention, some of these gains may reflect regression to the mean. To explore the effects on the pedagogical quality, we used the post-test KIDS score on the preschool unit level and ran a regression with the treatment indicator, strata fixed effects, and the pre-test KIDS score as explanatory variables. The treatment effect estimate is positive but not significant (β = 11.1, 95% confidence interval = [-49.1, 71.4]), while the pre-test KIDS score is positive and significant (β = 0.51, 95% confidence interval = [0.145, 0.882]).
In table A3, we explore whether the treatment effect is heterogeneous across the pre-treatment pedagogical quality by interacting the treatment indicator with the mean-centered pre-treatment KIDS score. None of the treatment or interaction effects are significant (p > 0.05), although some estimates are large. In particular, the treatment effect on the preliteracy test becomes much larger (and p < 0.1), as the interaction with the pre-treatment KIDS score is negative and sizeable. The interaction effect is also relatively large in the regression using the total SDQ score as the outcome variable.
Table A4 shows heterogeneity across pre-test scores. We examined heterogeneity by adding an interaction between the treatment indicator and the pre-test score of the outcome variable to the main specifications. The evidence of heterogeneity is weak: no interaction term is significant and with the partial exception of the total SDQ score, the interaction effects are relatively small.
| (1) | (2) | (3) | (4) | (5) | |
|---|---|---|---|---|---|
| VARIABLES | SDQ TOTAL | SDQ IMPACT | SDQ PROSOCIAL | LANGUAGE | PRELITERACY |
| Treatment | 0.751 | 0.125 | -0.225 | 5.835 | 9.474* |
| [-0.820, 2.55] | [-.0701, 0.274] | [-1.47, 0.617] | [-12.2, 24.0] | [-4.32, 20.9] | |
| Treatment x | 0.0122 | -0.00127 | 0.000560 | 0.0289 | -0.131 |
| Pre-KIDS | [-0.007, 0.021] | [-0.0037, .0020] | [-0.014, 0.024] | [-0.643, 0.558] | [-.031, 0.154] |
| Pre-KIDS | -0.0114 | 0.000899 | 0.00157 | 0.0624 | 0.201** |
| [-0.023, 0.017] | [-0.003, 0.004] | [-0.059,0.028] | [-0.344, 0.937] | [0.019, .655] | |
| Pre-treatment scores | |||||
| SDQ Total | 0.519*** | ||||
| [0.380, .686] | |||||
| SDQ Impact | 0.513*** | ||||
| [0.406, 0.601] | |||||
| SDQ Prosocial | 0.254*** | ||||
| [0.130, 0.396] | |||||
| Language total | 0.548*** | 0.328*** | |||
| [0.383, 0.744] | [0.142, 0.467] | ||||
| Observations | 296 | 293 | 299 | 178 | 171 |
| R2 | 0.302 | 0.304 | 0.145 | 0.368 | 0.231 |
Note: Source: Own measurements and calculations. All specifications include strata fixed effects, which are excluded from the table for brevity. Bounds on the 95% confidence set from wild-cluster bootstrap in brackets. ***p < 0.01, **p < 0.05, *p < 0.1.
| (1) | (2) | (3) | (4) | (5) | |
|---|---|---|---|---|---|
| VARIABLES | SDQ TOTAL | SDQ IMPACT | SDQ PROSOCIAL | LANGUAGE | PRELITERACY |
| Treatment | 1.867 | 0.110 | -0.148 | 3.420 | 5.889 |
| [-0.386, 4.25] | [-0.026, 0.265] | [-2.80, 2.62] | [-27.0, 26.8] | [-11.7, 24.9] | |
| Treatment x | -0.129 | 0.0192 | -0.0183 | -0.0398 | -0.0969 |
| pre-test | [-0.417, 0.125] | [-0.1601, .1968] | [-0.316, 0.229] | [-0.405, 0.436] | [-0.434, 0.246] |
| Pre-treatment scores | |||||
| SDQ Total | 0.574** | ||||
| [0.379, 0.907] | |||||
| SDQ Impact | 0.494*** | ||||
| [0.277, 0.670] | |||||
| SDQ Prosocial | 0.274** | ||||
| [0.076, 0.546] | |||||
| Language total | 0.579*** | 0.395** | |||
| [0.391, 0.845] | [0.065, 0.595] | ||||
| Observations | 296 | 293 | 299 | 178 | 171 |
| R2 | 0.301 | 0.298 | 0.141 | 0.353 | 0.171 |
Note: Source: Own measurements and calculations. All specifications include strata fixed effects, which are excluded from the table for brevity. Bounds on the 95% confidence set from wild-cluster bootstrap in brackets. ***p < 0.01, **p <0 .05, *p < 0.1.
A4.1 Intervention dosage
Although not statistically significant, the SDQ estimates raise the question of whether the intervention changed practices for the worse. In Table A5, we report results from estimations in which we replicated the primary analysis with a sample of children who left their preschool units in April 2018 because they were starting primary school (“school starters”). Preschool staff conducted SDQ assessments for this group between March-April 2018, which implies that they only received about a year of the intervention. Because of the considerably longer assessment time for the language test, it was not possible to conduct these tests of intervention dosage for school starters. If the changed practices were harmful, then we would expect smaller effects for the group that was exposed to the intervention for a shorter period of time.
| (1) | (2) | (3) | |
|---|---|---|---|
| VARIABLES | SDQ TOTAL | SDQ IMPACT | SDQ PROSOCIAL |
| Treatment | 0.992 [-2.16, 3.94] | 0.204 [-0.064, 0.465] | -0.580 [-1.356, .3344] |
| Pre-treatment scores | |||
| SDQ Total | 0.571*** [0.364, 0.779] | ||
| SDQ Impact | 0.367*** [0.245, 0.492] | ||
| SDQ Prosocial | 0.363*** [0.244, 0.469] | ||
| Observations | 260 | 266 | 263 |
| R2 | 0.448 | 0.227 | 0.236 |
Note: Source: Own measurements and calculations. All specifications include strata fixed effects, which are excluded from the table for brevity. Bounds on the 95% confidence set from wild-cluster bootstrap in brackets. ***p < 0.01, **p < 0.05, *p < 0.1.
The estimates in Table A5 do not indicate less harmful effects for school starters. The estimates are either slightly more harmful (for the total SDQ score) or quite a lot more harmful on the impact measure and the prosocial scale in the sample of school starters compared with the sample used in the primary analysis. That is, they indicate more harmful effects for the group that was exposed to the intervention for a shorter period time, which is not what we would expect to see if the intervention had changed practices for the worse.
A second group who received considerably less of the intervention is children who were not assessed at pre-test and were relatively young at the time of the post-test. Young children taking the post-test are likely to have transferred from nursery centers or family daycare recently and we would therefore expect attenuated treatment effects on them.
Figure A5-A7 shows the treatment effect estimates for the three SDQ-based measures and the bounds on the 95% confidence sets from specifications where we progressively remove children with shorter exposure from the regression sample. The first estimate in each figure (c1) uses the primary analysis sample for reference but does not include the pre-test as a covariate. We excluded the pre-test because most children in the other categories did not take a pre-test and we wanted to make the specification as similar as possible. Category 2 (c2) includes all children without a pre-test, who on average are younger than our primary sample and received less of the intervention. The remaining categories (c3-c5) simply exclude the oldest 25%, 50%, and 75% from the sample.
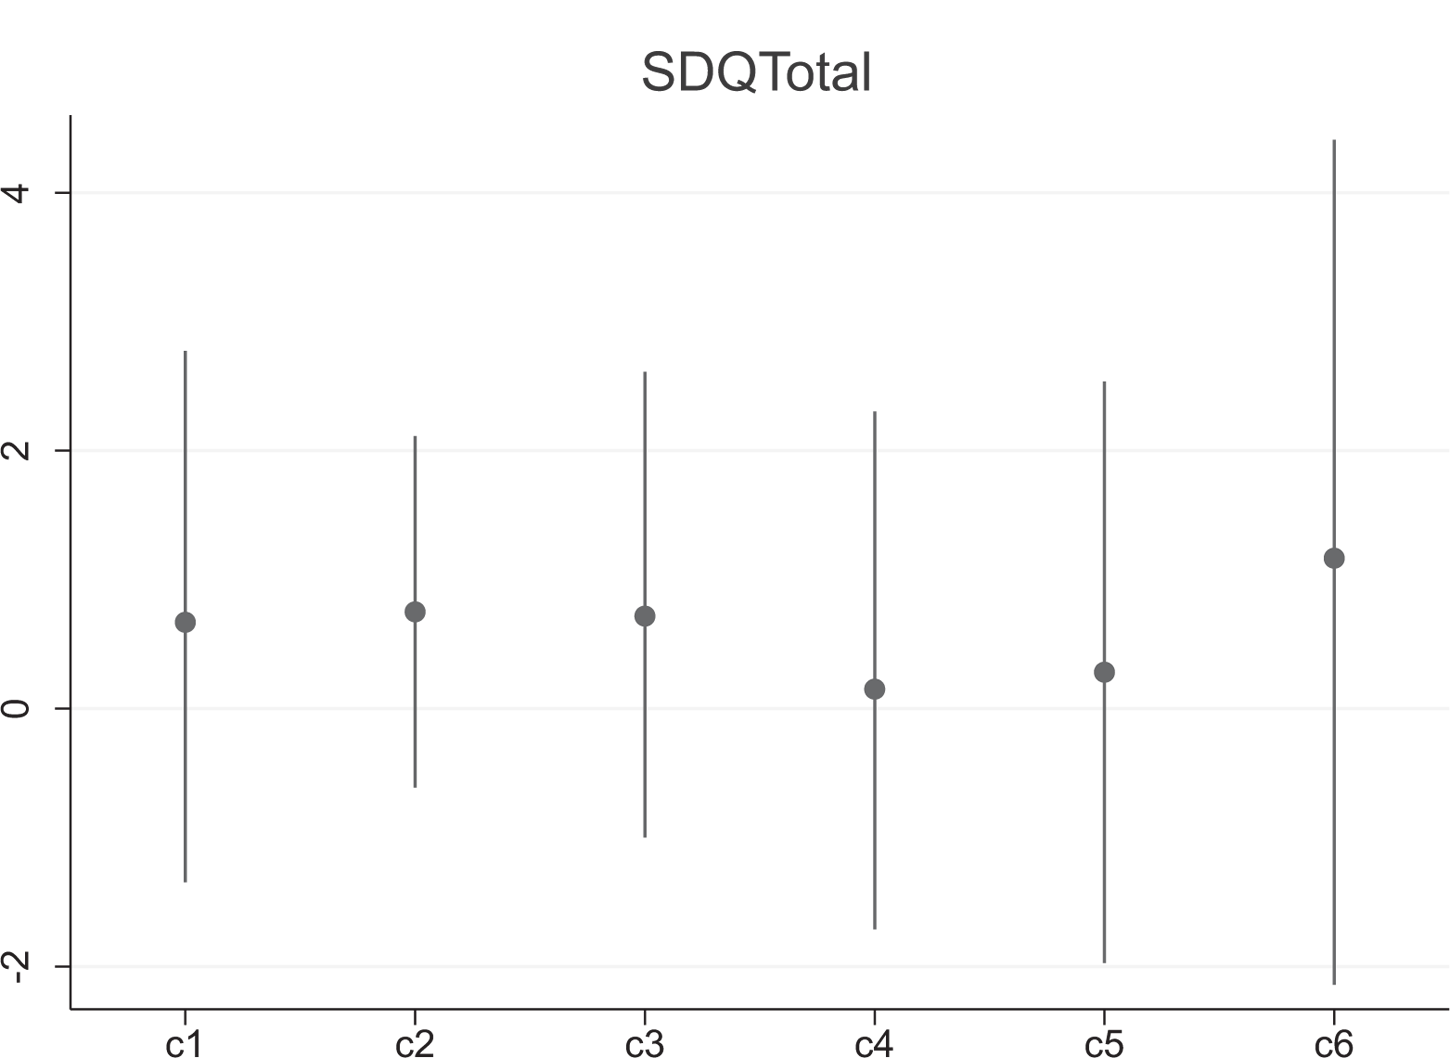

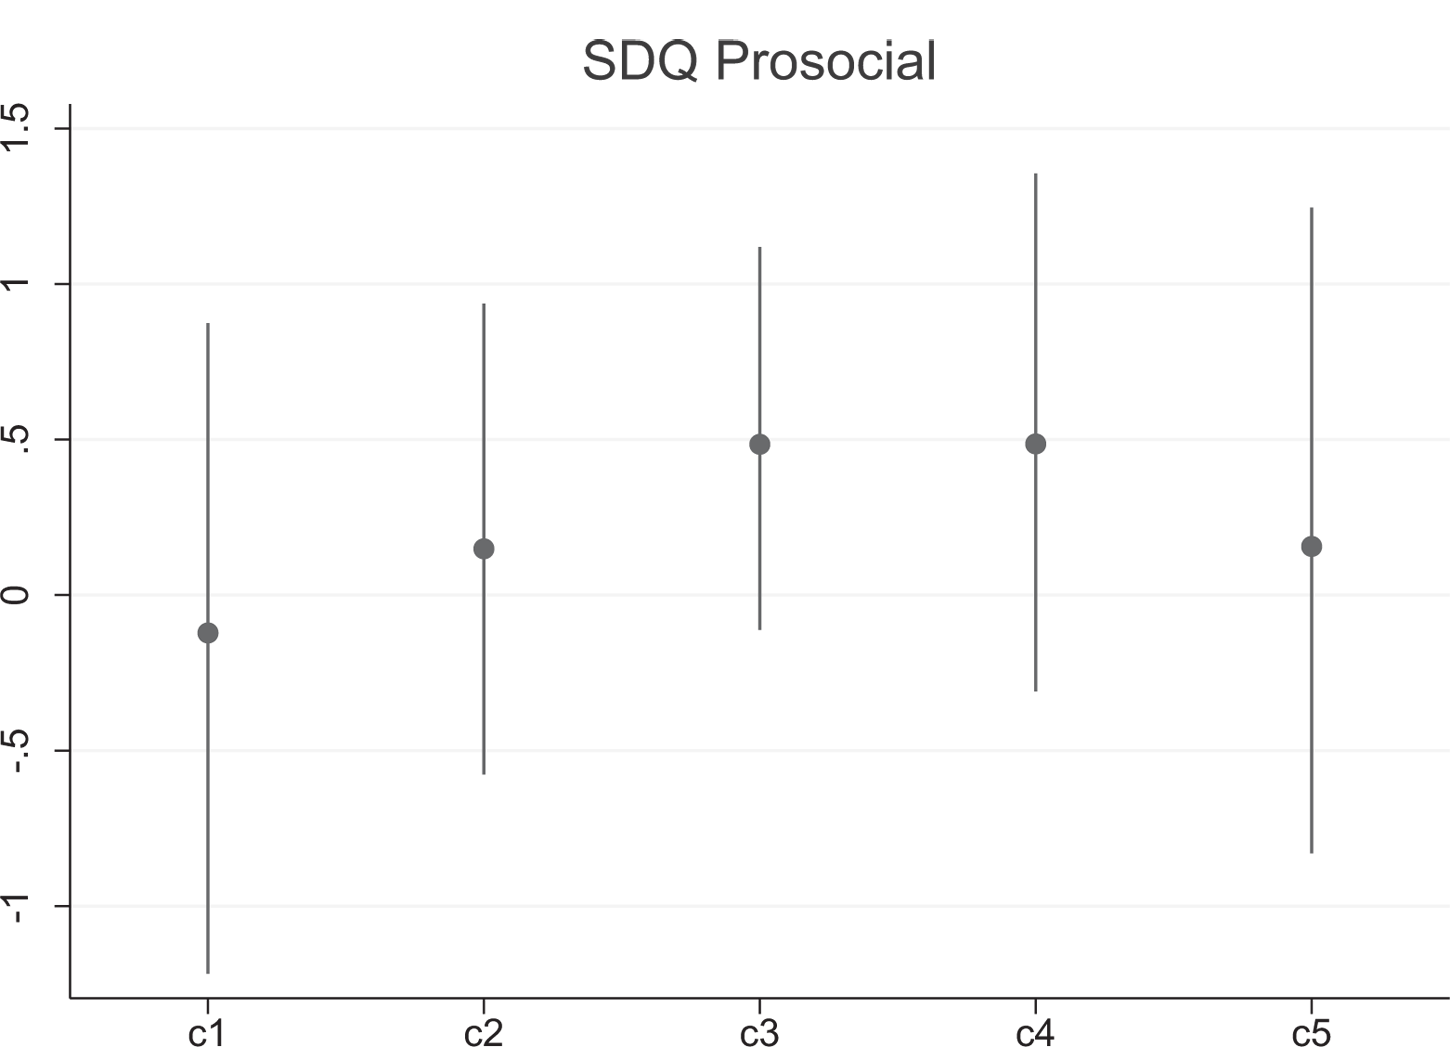
The figures show no evidence of monotonically declining (total SDQ score and the impact measure) or increasing estimates (prosocial scale), which would have indicated dosage effects. For the total SDQ score, the youngest sample, who were exposed the least to the intervention, has the largest effect (most harmful). The impact measure shows a nonlinear development. Although the prosocial scale increases as the sample progressively gets younger, it does so in a nonlinear way and the estimates actually turn beneficial for c3-c5. Small doses of a harmful intervention should still be harmful, so beneficial estimates seem inconsistent with a harmful intervention.
Summing up the intervention dosage estimations, we found no evidence that groups who received a smaller dose of the intervention had less harmful treatment effect estimates. If anything, we found the opposite pattern. Although we cannot rule out that changed practices contributed to the harmful estimates, these results are consistent with the hypothesis that the intervention changed the staff’s reporting rather than had a harmful impact on the children.
Fotnoter
- 1 An example of a targeted program is the federal Head Start program in the United States, which targets children from disadvantaged backgrounds (Kline & Walters, 2016).
- 2 The results for the full sample tested at post-test, shown in the Online Appendix, are similar.
- 3 Kersten et al. (2016) found a lack of evidence for the test-retest reliability, cultural validity, and criterion validity of the scale. However, although this lack may be of concern for clinical practice, Kersten et al. found strong evidence for discriminative, structural, and convergent validity as well as the internal consistency of the total score, and the scale is acceptable for comparing groups, which is our primary objective in this paper.
- 4 Bleses et al. (2018) report correlations between the subscales and two well-known American tests. The correlations ranged from 0.33 to 0.57 for the Peabody Picture Vocabulary Test and from 0.15 to 0.49 for the Expressive Vocabulary Test.
- 5 We calculated effect sizes for the continuous measures by dividing the treatment effect estimate by the estimated standard deviation from a hierarchical model containing only an intercept. The effect sizes for the total SDQ score and the prosocial scores are ES = 0.15 and ES = -0.14 (both indicating harmful effects). Transforming the percentile scores of the language and literacy tests to standardized mean differences yields ES = 0.07 and ES = 0.08, respectively (both indicating beneficial effects). However, as the percentile scores are non-linear transformations of the underlying raw scores (which we do not have access to), the reader should interpret this comparison of effect sizes with caution.
- 1 Preschool size is not significant in any specification and the KIDS score is only significant in the specification using the preliteracy composite as the outcome variable (results not shown but available on request).